
Mortgage bond prices slipped lower and the 10-year Treasury yield moved modestly higher this past week while the major stock market indices put in a mixed performance. While the Dow Jones Industrial Average and the S&P 500 saw some decent gains, the technology-heavy NASDAQ Composite Index took it on the chin following social media giant Facebook's 19% plunge on Thursday. Facebook's dive marked the largest-ever one-day drop in market value for a U.S.-listed company to the tune of -$119.1 billion. In economic news, the preliminary reading for 2 nd Quarter GDP showed an annualized increase of 4.1%. This matched most analyst forecasts although there were those hoping for a more robust number closer to 5%. This was the best GDP reading since the third quarter of 2014, driven mostly by consumer spending which increased 4.0% and contributed 2.69 percentage points to the GDP total. In political news, President Trump scored a promising trade deal with European Commission President Jean-Claude Juncker on Wednesday. President Trump procured trade concessions from the European Union (EU) whereby the EU would import more soybeans and natural gas from the U.S. and improve market access for U.S. medical devices. Future negotiations will be taking place on auto tariffs. In housing, the National Association of Realtors reported sales of Existing Homes edged 0.6% lower in June to a seasonally adjusted annual rate of 5.38 million. This was slightly below the consensus forecast of 5.45 million and also below a downwardly revised 5.41 million in May. Compared with a year earlier, sales in June fell 2.2% and have now fallen year-over-year for four straight months. The median existing home price for all housing types increased 5.2% to an all-time high of $276,900 – the 76th straight month of year-over-year gains. The median existing single-family home price was 5.2% higher from a year ago reaching $279,300. The inventory of existing homes for sale at the end of June increased 4.3% to 1.95 million while unsold inventory is at a 4.3-month supply at the current sales rate. Overall, low housing supply continues to act as a burden on overall sales in addition to high prices on available inventory hindering affordability, especially for first-time buyers seeing home prices rise faster than income. 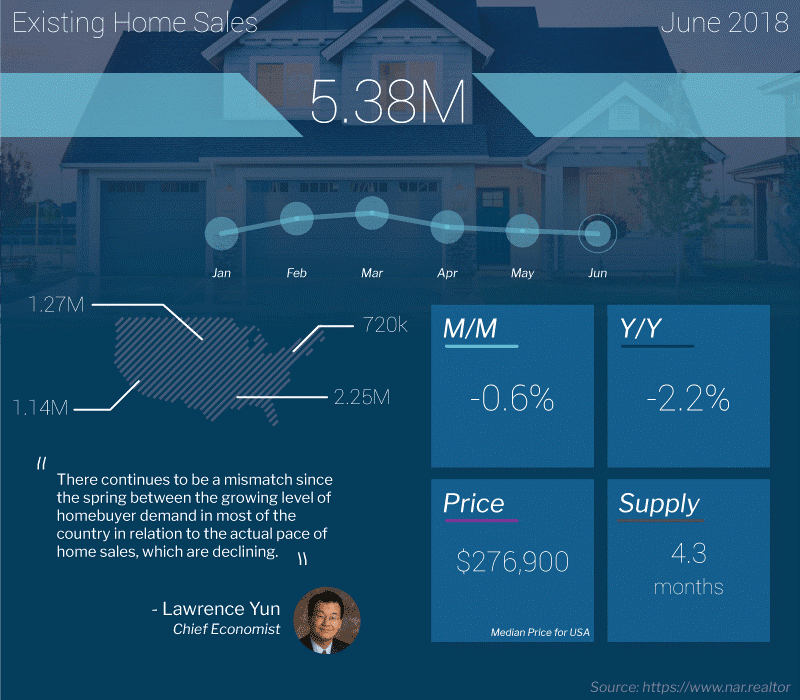 Last Wednesday, the Commerce Department reported sales of New Homes declined 5.3% from May through June to a seasonally adjusted annual rate of 631,000, the weakest rate in eight months possibly indicating the housing market is cooling off. This was the slowest pace for new-home sales since October. Plus, the three-month average for new home sales was 646,000 for the three months ending in June, the lowest average since the period that ended in February. The median sales price decreased 4.2% year-over-year to $302,100 while the average sales price decreased 2.0% to $363,300. With the current sales rate, the inventory of new homes for sale increased to a 5.7-months' supply compared to 5.3 months in May and 5.3 months in the year-ago period. One thing to worry about is the June swoon took place despite a decline in median and average selling prices. The latest data from the Mortgage Bankers Association’s (MBA) weekly mortgage applications survey released on Wednesday showed a decrease in mortgage applications. The MBA reported their overall seasonally adjusted Market Composite Index (application volume) fell 0.2% during the week ended July 20, 2018. The seasonally adjusted Purchase Index decreased 1.0% from the week prior while the Refinance Index increased by 1.0% from a week earlier. Overall, the refinance portion of mortgage activity increased to 36.8% from 36.5% of total applications from the prior week. The adjustable-rate mortgage share of activity increased to 6.3% from 6.1% of total applications. According to the MBA, the average contract interest rate for 30-year fixed-rate mortgages with a conforming loan balance was unchanged at 4.77% with points decreasing to 0.45 from 0.46. For the week, the FNMA 4.0% coupon bond lost 25.0 basis points to close at $101.563 while the 10-year Treasury yield increased 6.49 basis points to end at 2.9580%. The Dow Jones Industrial Average gained 392.94 points to close at 25,451.06. The NASDAQ Composite Index fell 82.78 points to close at 7,737.42. The S&P 500 Index advanced 16.99 points to close at 2,818.82. Year to date on a total return basis, the Dow Jones Industrial Average has gained 2.96%, the NASDAQ Composite Index has advanced 12.08%, and the S&P 500 Index has added 5.43%. This past week, the national average 30-year mortgage rate climbed to 4.72% from 4.63%; the 15-year mortgage rate rose to 4.19% from 4.13%; the 5/1 ARM mortgage rate increased to 4.00% from 3.96% while the FHA 30-year rate rose to 4.42% from 4.37%. Jumbo 30-year rates remained unchanged at 4.50%. Economic Calendar - for the Week of July 30, 2018 Economic reports having the greatest potential impact on the financial markets are highlighted in bold.
 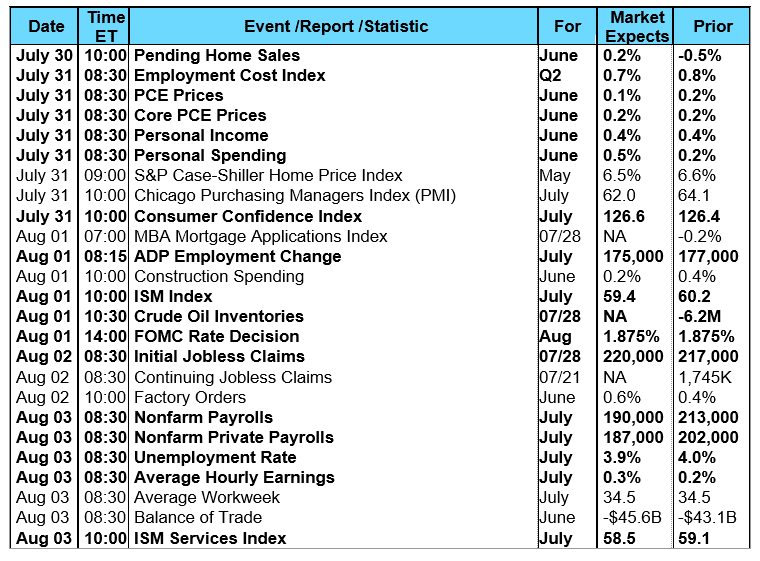 Mortgage Rate Forecast with Chart - FNMA 30-Year 4.0% Coupon Bond The FNMA 30-year 4.0% coupon bond ($101.563, -25.0 bp) traded within a narrow 37.5 basis point range between a weekly intraday high of 101.84 on Monday and a weekly intraday low of $101.47 on Friday before closing the week at $101.563 on Friday. After taking a step lower below technical support last Monday, mortgage bonds continued to trade mostly in a sideways direction. They are now deeply “oversold” and could take a turn higher this coming week on either disappointing economic news or a faltering stock market. If mortgage bonds do turn higher they will face a stiff, multiple layer of overhead resistance as shown on the chart below. The chart suggests there will be stable to slightly improved mortgage rates this coming week
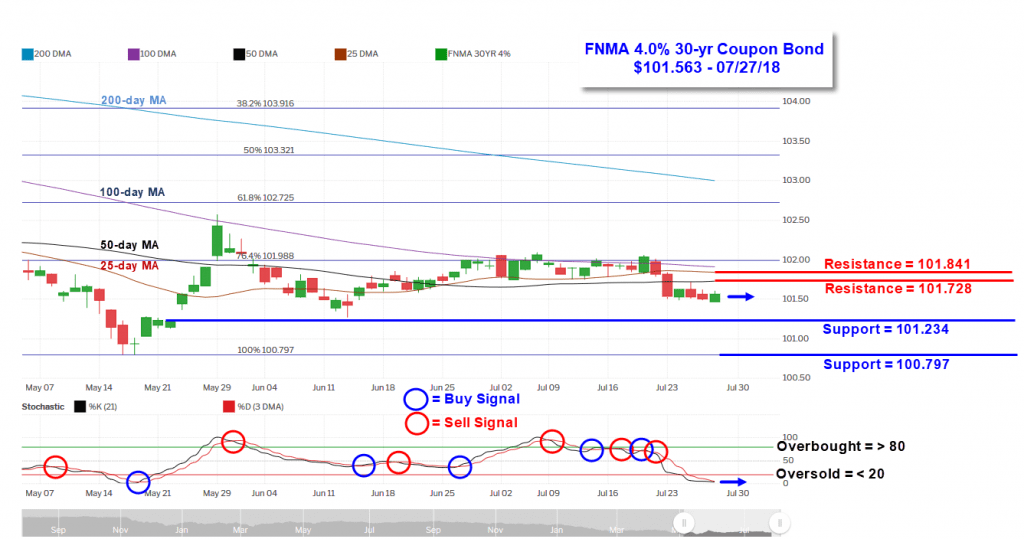
Last Wednesday, the Commerce Department reported sales of New Homes declined 5.3% from May through June to a seasonally adjusted annual rate of 631,000, the weakest rate in eight months possibly indicating the housing market is cooling off. This was the slowest pace for new-home sales since October. Plus, the three-month average for new home sales was 646,000 for the three months ending in June, the lowest average since the period that ended in February. The median sales price decreased 4.2% year-over-year to $302,100 while the average sales price decreased 2.0% to $363,300. With the current sales rate, the inventory of new homes for sale increased to a 5.7-months' supply compared to 5.3 months in May and 5.3 months in the year-ago period. One thing to worry about is the June swoon took place despite a decline in median and average selling prices. The latest data from the Mortgage Bankers Association’s (MBA) weekly mortgage applications survey released on Wednesday showed a decrease in mortgage applications. The MBA reported their overall seasonally adjusted Market Composite Index (application volume) fell 0.2% during the week ended July 20, 2018. The seasonally adjusted Purchase Index decreased 1.0% from the week prior while the Refinance Index increased by 1.0% from a week earlier. Overall, the refinance portion of mortgage activity increased to 36.8% from 36.5% of total applications from the prior week. The adjustable-rate mortgage share of activity increased to 6.3% from 6.1% of total applications. According to the MBA, the average contract interest rate for 30-year fixed-rate mortgages with a conforming loan balance was unchanged at 4.77% with points decreasing to 0.45 from 0.46. For the week, the FNMA 4.0% coupon bond lost 25.0 basis points to close at $101.563 while the 10-year Treasury yield increased 6.49 basis points to end at 2.9580%. The Dow Jones Industrial Average gained 392.94 points to close at 25,451.06. The NASDAQ Composite Index fell 82.78 points to close at 7,737.42. The S&P 500 Index advanced 16.99 points to close at 2,818.82. Year to date on a total return basis, the Dow Jones Industrial Average has gained 2.96%, the NASDAQ Composite Index has advanced 12.08%, and the S&P 500 Index has added 5.43%. This past week, the national average 30-year mortgage rate climbed to 4.72% from 4.63%; the 15-year mortgage rate rose to 4.19% from 4.13%; the 5/1 ARM mortgage rate increased to 4.00% from 3.96% while the FHA 30-year rate rose to 4.42% from 4.37%. Jumbo 30-year rates remained unchanged at 4.50%. Economic Calendar - for the Week of July 30, 2018 Economic reports having the greatest potential impact on the financial markets are highlighted in bold. Mortgage Rate Forecast with Chart - FNMA 30-Year 4.0% Coupon Bond The FNMA 30-year 4.0% coupon bond ($101.563, -25.0 bp) traded within a narrow 37.5 basis point range between a weekly intraday high of 101.84 on Monday and a weekly intraday low of $101.47 on Friday before closing the week at $101.563 on Friday. After taking a step lower below technical support last Monday, mortgage bonds continued to trade mostly in a sideways direction. They are now deeply “oversold” and could take a turn higher this coming week on either disappointing economic news or a faltering stock market. If mortgage bonds do turn higher they will face a stiff, multiple layer of overhead resistance as shown on the chart below. The chart suggests there will be stable to slightly improved mortgage rates this coming week