
The major stock market indexes managed to grind out some marginal gains as investors reflected on a torrent of uncertain geopolitical news centered on U.S.-China trade negotiations and the U.S.-North Korea summit “canceled” last Thursday by President Trump. Still, White House press secretary Sarah Sanders stated a “pre-advance team for Singapore will leave as scheduled in order to prepare should the summit take place.” This uncertainty coupled with a “dovish” set of Federal Reserve minutes from the May FOMC meeting increased demand for “safe-haven” assets such as Treasuries and mortgage bonds to drive bond yields noticeably lower for the week. The FOMC minutes suggested there will be a rate hike at the June Fed meeting, as widely expected, but also implied the Fed may not be as aggressive with its pace of future rate hikes as previously thought. The minutes indicated Fed officials would be willing to let inflation run temporarily above their stated 2.0% target and this took some pressure off of the bond market. A sharp sell-off in crude oil prices was also a contributing factor as reports surfaced that Russia and Saudi Arabia would soon boost oil production in response to significantly lower production in Venezuela, a country with the highest known oil reserves in the world, but whose economy is in shambles. There were several housing related reports released this past week. The Commerce Department reported last Wednesday that purchases of newly built single-family homes fell 1.5% to a seasonally adjusted annual rate of 662,000 in April. However, economists had forecast a larger 2.2% drop. Housing market inventory remains extremely tight, helping to drive up home prices. The average new home sales price climbed to $407,300 in April, the highest price since records have been kept beginning in 1963. At the current sales pace, there was a 5.4-month supply of new homes on the market by the end of March. 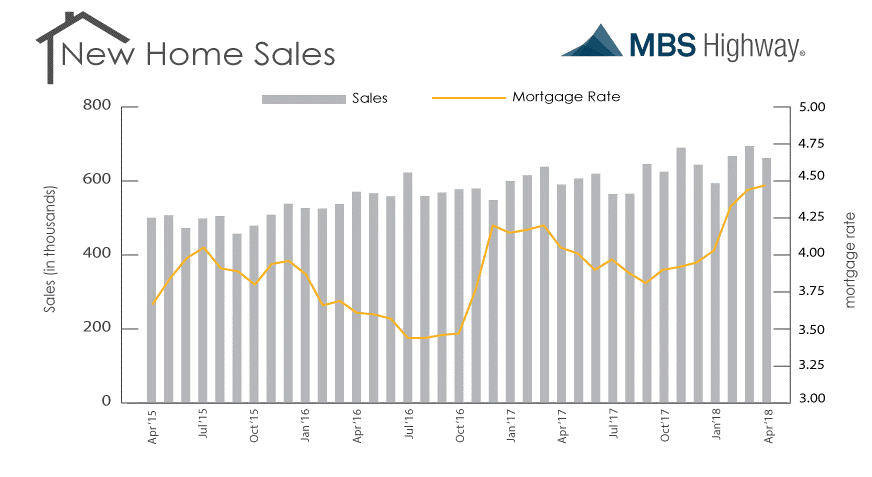 Thursday, the National Association of Realtors reported Existing Home Sales fell 2.5% month-over-month in April to a seasonally adjusted annual rate of 5.46 million. This was below the consensus forecast of 5.57 million and lower than the 5.60 million in March. Median prices of existing homes for sale for all housing types increased 5.3% to $257,900 while those for existing single-family homes increased 5.5% from a year ago to $259,900. While the inventory of homes for sale at the end of April increased 9.8% to 1.80 million, this is still 6.3% lower than the same period a year ago. At the current sales pace, unsold existing home inventory is only at a 4.0-month supply compared to the more normal 6.0-month supply characteristic of a more balanced market.
 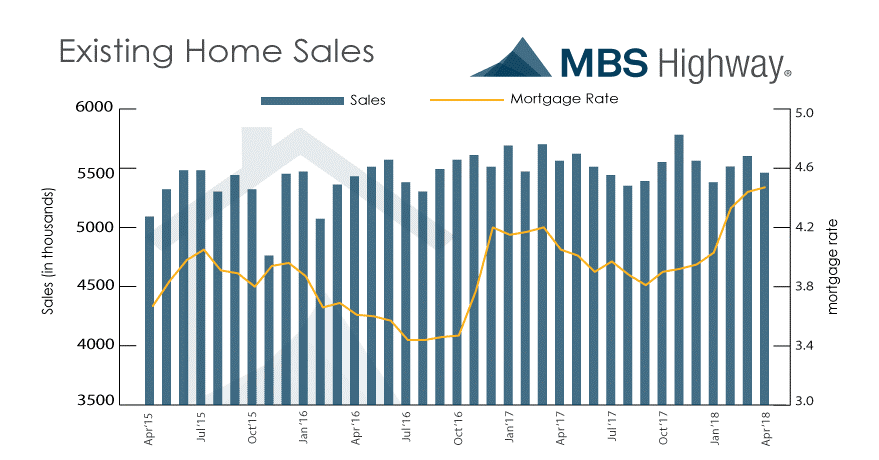 From the mortgage industry, the latest data from the Mortgage Bankers Association’s (MBA) weekly mortgage applications survey continued to show a decline in mortgage applications. The MBA reported their overall seasonally adjusted Market Composite Index (application volume) decreased 2.6% during the week ended May 18, 2018. The seasonally adjusted Purchase Index fell 2.0% from the week prior while the Refinance Index decreased by 4.0% to its lowest level since December 2000. Overall, the refinance portion of mortgage activity fell to 35.7% from 35.9% of total applications from the prior week. The adjustable-rate mortgage share of activity increased to 6.8% from 6.5% of total applications. According to the MBA, the average contract interest rate for 30-year fixed-rate mortgages with a conforming loan balance increased to 4.86%, its highest level since April 2011, from 4.77% with points increasing to 0.52. For the week, the FNMA 4.0% coupon bond gained 59.3 basis points to close at $101.859 while the 10-year Treasury yield decreased 12.9 basis points to end at 2.931%. The three major stock indexes ended modestly higher for the week. The Dow Jones Industrial Average gained 38.00 points to close at 24,753.09. The NASDAQ Composite Index added 79.51 points to close at 7,433.85. The S&P 500 Index rose 8.36 points to close at 2,721.33. Year to date on a total return basis, the Dow Jones Industrial Average has gained 0.14%, the NASDAQ Composite Index has added 7.68%, and the S&P 500 Index has advanced 1.78%. This past week, the national average 30-year mortgage rate decreased to 4.61% from 4.78%; the 15-year mortgage rate fell to 4.04% from 4.21%; the 5/1 ARM mortgage rate decreased to 3.95% from 4.00% while the FHA 30-year rate dropped to 4.40% from 4.50%. Jumbo 30-year rates decreased to 4.65% from 4.80%. Economic Calendar - for the Week of May 28, 2018
 Economic reports having the greatest potential impact on the financial markets are highlighted in bold. Mortgage Rate Forecast with Chart - FNMA 30-Year 4.0% Coupon Bond The FNMA 30-year 4.0% coupon bond ($101.859, +59.3 bp) traded within a narrower 76.6 basis point range between a weekly intraday high of 101.891 on Friday and a weekly intraday low of $101.125 on Monday and Tuesday before closing the week at $101.859 on Friday. As predicted in last week’s newsletter, the bond did manage to trade higher during the week to set up a test of overhead resistance now located at the 50-day moving average and the 76.4% Fibonacci retracement level. Now approaching “Overbought” levels, it will be difficult from a technical perspective for the bond to pass this test and break above this formidable layer of resistance, and we could see bond prices turned away from the 50-day moving average resulting in slightly worse mortgage rates. However, there is a plethora of potential market-moving economic news headed our way this week headlined by the May employment report. Should the week’s economic data disappoint stock investors, we could see bond prices improve and break above resistance resulting in an improvement in rates.
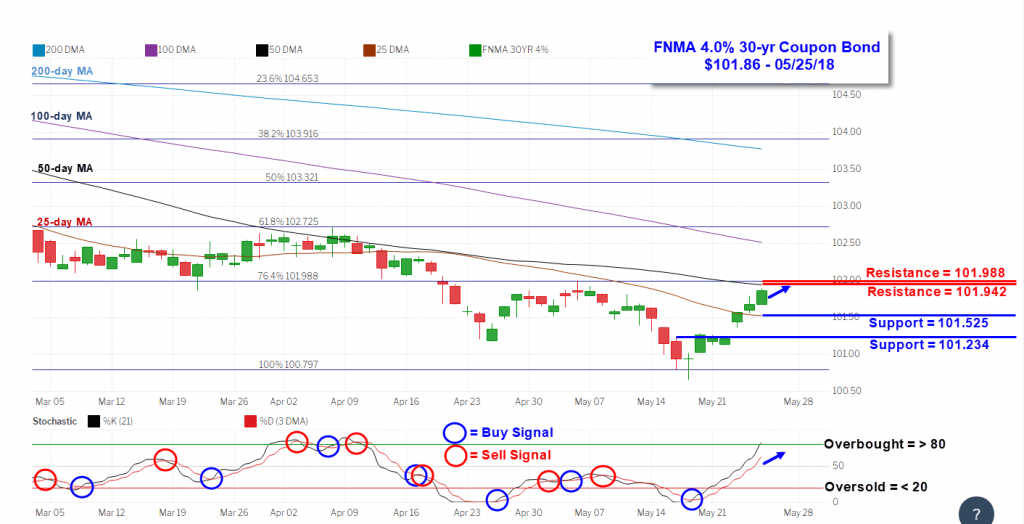
Thursday, the National Association of Realtors reported Existing Home Sales fell 2.5% month-over-month in April to a seasonally adjusted annual rate of 5.46 million. This was below the consensus forecast of 5.57 million and lower than the 5.60 million in March. Median prices of existing homes for sale for all housing types increased 5.3% to $257,900 while those for existing single-family homes increased 5.5% from a year ago to $259,900. While the inventory of homes for sale at the end of April increased 9.8% to 1.80 million, this is still 6.3% lower than the same period a year ago. At the current sales pace, unsold existing home inventory is only at a 4.0-month supply compared to the more normal 6.0-month supply characteristic of a more balanced market. From the mortgage industry, the latest data from the Mortgage Bankers Association’s (MBA) weekly mortgage applications survey continued to show a decline in mortgage applications. The MBA reported their overall seasonally adjusted Market Composite Index (application volume) decreased 2.6% during the week ended May 18, 2018. The seasonally adjusted Purchase Index fell 2.0% from the week prior while the Refinance Index decreased by 4.0% to its lowest level since December 2000. Overall, the refinance portion of mortgage activity fell to 35.7% from 35.9% of total applications from the prior week. The adjustable-rate mortgage share of activity increased to 6.8% from 6.5% of total applications. According to the MBA, the average contract interest rate for 30-year fixed-rate mortgages with a conforming loan balance increased to 4.86%, its highest level since April 2011, from 4.77% with points increasing to 0.52. For the week, the FNMA 4.0% coupon bond gained 59.3 basis points to close at $101.859 while the 10-year Treasury yield decreased 12.9 basis points to end at 2.931%. The three major stock indexes ended modestly higher for the week. The Dow Jones Industrial Average gained 38.00 points to close at 24,753.09. The NASDAQ Composite Index added 79.51 points to close at 7,433.85. The S&P 500 Index rose 8.36 points to close at 2,721.33. Year to date on a total return basis, the Dow Jones Industrial Average has gained 0.14%, the NASDAQ Composite Index has added 7.68%, and the S&P 500 Index has advanced 1.78%. This past week, the national average 30-year mortgage rate decreased to 4.61% from 4.78%; the 15-year mortgage rate fell to 4.04% from 4.21%; the 5/1 ARM mortgage rate decreased to 3.95% from 4.00% while the FHA 30-year rate dropped to 4.40% from 4.50%. Jumbo 30-year rates decreased to 4.65% from 4.80%. Economic Calendar - for the Week of May 28, 2018 Economic reports having the greatest potential impact on the financial markets are highlighted in bold. Mortgage Rate Forecast with Chart - FNMA 30-Year 4.0% Coupon Bond The FNMA 30-year 4.0% coupon bond ($101.859, +59.3 bp) traded within a narrower 76.6 basis point range between a weekly intraday high of 101.891 on Friday and a weekly intraday low of $101.125 on Monday and Tuesday before closing the week at $101.859 on Friday. As predicted in last week’s newsletter, the bond did manage to trade higher during the week to set up a test of overhead resistance now located at the 50-day moving average and the 76.4% Fibonacci retracement level. Now approaching “Overbought” levels, it will be difficult from a technical perspective for the bond to pass this test and break above this formidable layer of resistance, and we could see bond prices turned away from the 50-day moving average resulting in slightly worse mortgage rates. However, there is a plethora of potential market-moving economic news headed our way this week headlined by the May employment report. Should the week’s economic data disappoint stock investors, we could see bond prices improve and break above resistance resulting in an improvement in rates.