
Trade tensions and inflation data dominated investor sentiment creating increased volatility in the stock market. Stocks got off to a good start last Monday primarily due to a lack of any bad news over the prior weekend. Stocks then fell on Wednesday when trade tensions surfaced on news the U.S. would continue its plan to enact an additional $200 billion worth of tariffs on a variety of Chinese goods to begin a few months from now. However, this threat was not met with an immediate response from China and investors viewed this as a positive sign helping the stock market to recover on Thursday. In fact, the technology laden NASDAQ Composite Index set a new all-time high on Thursday and Friday. Inflation data came in a little hotter than expected with the Producer Price Index rising 0.3% in June following a 0.5% increase in May. On an annualized basis, Producer Prices have increased 3.4%, their fastest increase in almost seven years. Increased costs for steel and aluminum were noticeable suggesting the tariffs recently put in place by the Trump administration for these metals are beginning to drive input costs higher for manufacturers. Also, inflation at the consumer level edged higher but was within the consensus forecast. The headline Consumer Price Index (CPI) in June increased 0.1% with the Core CPI rising 0.2%. However, consumer prices have risen 2.9% over the past year for its highest rate in six years. This year-over-year rate more than offsets the 2.7% increase in average annual wages over the same time period leading to growing inflation concerns. These concerns have shown up in the latest Consumer Sentiment report from the University of Michigan where it was noted “The primary concerns expressed by consumers were a decline in the future pace of economic growth and an uptick in inflation.” In housing, the latest data from the Mortgage Bankers Association’s (MBA) weekly mortgage applications survey released on Wednesday showed an increase in mortgage applications. The MBA reported their overall seasonally adjusted Market Composite Index (application volume) rose 2.5% during the week ended July 6, 2018. The seasonally adjusted Purchase Index increased 7.0% from the week prior while the Refinance Index decreased by 4.0% from a week earlier to its lowest level since December 2000. Overall, the refinance portion of mortgage activity decreased to 34.8% from 37.2% of total applications from the prior week. The adjustable-rate mortgage share of activity decreased to 6.3% from 6.7% of total applications. According to the MBA, the average contract interest rate for 30-year fixed-rate mortgages with a conforming loan balance decreased to 4.76% from 4.79% with points increasing to 0.43 from 0.41. For the week, the FNMA 4.0% coupon bond lost 7.9 basis points to close at $101.984 while the 10-year Treasury yield increased 0.068 of one basis point to end at 2.8308%. The Dow Jones Industrial Average gained 562.93 points to close at 25,019.41. The NASDAQ Composite Index advanced 137.59 points to close at 7,825.98. The S&P 500 Index added 41.49 points to close at 2,801.31. Year to date on a total return basis, the Dow Jones Industrial Average has gained 1.21%, the NASDAQ Composite Index has advanced 13.36%, and the S&P 500 Index has added 4.78%. This past week, the national average 30-year mortgage rate decreased to 4.63% from 4.65%; the 15-year mortgage rate fell to 4.12% from 4.13%; the 5/1 ARM mortgage rate decreased to 3.95% from 3.99% while the FHA 30-year rate fell to 4.35% from 4.37%. Jumbo 30-year rates decreased to 4.54% from 4.59%. Economic Calendar - for the Week of July 16, 2018 Economic reports having the greatest potential impact on the financial markets are highlighted in bold. 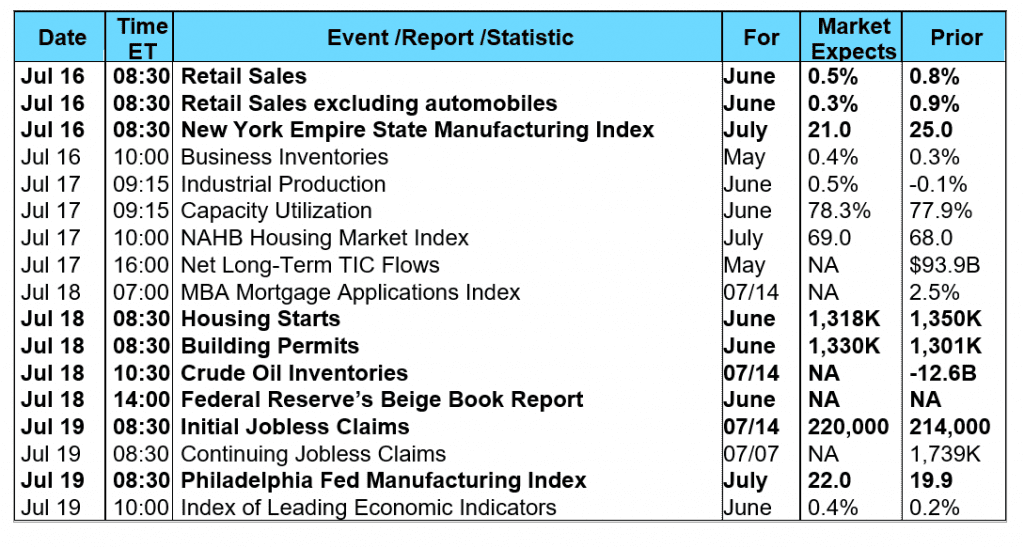 Mortgage Rate Forecast with Chart - FNMA 30-Year 4.0% Coupon Bond The FNMA 30-year 4.0% coupon bond ($101.984, -7.9 bp) traded within a narrower 26.6 basis point range between a weekly intra-day high of 102.016 on Friday and a weekly intraday low of $101.750 on Wednesday and Thursday before closing the week at $101.984 on Friday. Mortgage bonds traded within a narrow range between resistance and support levels ending the week close to resistance located at $101.988 on Friday. A weak sell signal on Tuesday was followed by a weak buy signal on Friday suggesting the bond could continue to consolidate and trade sideways like it did last week. This should result in stable mortgage rates this coming week
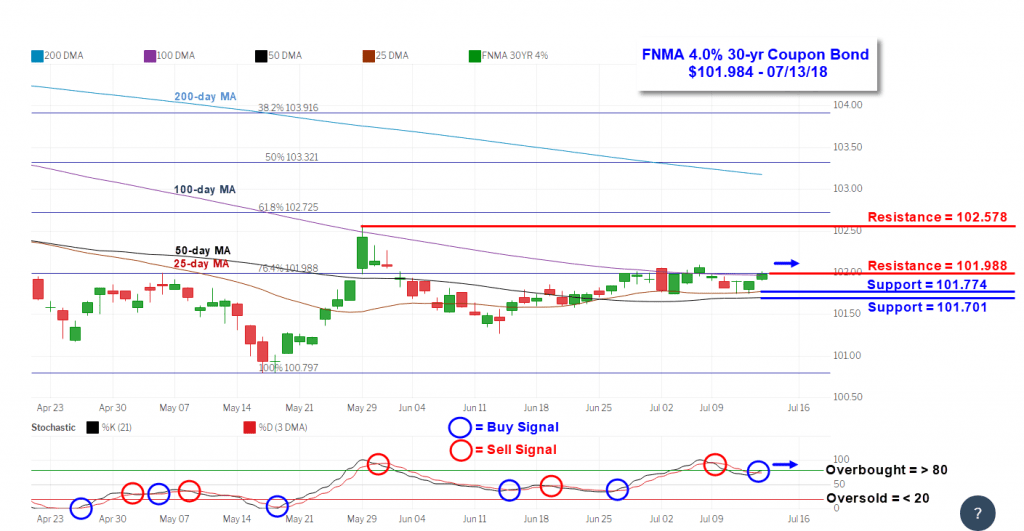
Mortgage Rate Forecast with Chart - FNMA 30-Year 4.0% Coupon Bond The FNMA 30-year 4.0% coupon bond ($101.984, -7.9 bp) traded within a narrower 26.6 basis point range between a weekly intra-day high of 102.016 on Friday and a weekly intraday low of $101.750 on Wednesday and Thursday before closing the week at $101.984 on Friday. Mortgage bonds traded within a narrow range between resistance and support levels ending the week close to resistance located at $101.988 on Friday. A weak sell signal on Tuesday was followed by a weak buy signal on Friday suggesting the bond could continue to consolidate and trade sideways like it did last week. This should result in stable mortgage rates this coming week