The stock and bond markets traded relatively flat for the week. The major stock indexes ended “mixed” with the Dow Jones Industrial Average and S&P 500 edging lower while the NASDAQ Composite Index reached another new high before recording a 20 point weekly gain. Mortgage bonds gained a few basis points while most mortgage rates ended the week unchanged from the prior week. Political turmoil generated by scheming democrats aided by a colluding mainstream media over President Trump’s firing of FBI Director James Comey appeared to have weighed on investor sentiment. The generated political storm raised uncertainty about the ability of the president to build a consensus to pass market-friendly legislation including meaningful tax reform. Ongoing tensions from North Korea also hindered the stock market after the North Korean ambassador to the UN voiced new threats directed at the U.S. on Tuesday. The week’s economic news was also mixed. Weekly Initial Jobless Claims were reported below consensus estimates and near four-decade lows, while continuing claims hit their lowest level since 1988. April Retail Sales disappointed with a less than expected increase of 0.4% versus a 0.6% forecast. Inflation as measured by the Consumer Price Index (CPI) was benign with a gain of 0.2% while the Core CPI, which excludes food and energy, gained only 0.1% when the consensus forecast was for a reading of 0.2%. On a year-over-year basis, total CPI is up 2.2% while the Core CPI has risen 1.9%. Chicago Fed President Charles Evans remarked after the CPI report that he expects one or two additional rate hikes this year with the actual number depending on the level of inflation. The June FOMC meeting on June 14 still looks like the date for the next rate hike. The Fed funds futures market currently shows an implied probability of 78.5% for a hike. As for mortgages, mortgage application volume increased during the week ending May 5. The Mortgage Bankers Association (MBA) reported their overall seasonally adjusted Market Composite Index (application volume) rose 2.4%. The seasonally adjusted Purchase Index increased 2.0% from the prior week, while the Refinance Index increased 3.0%. Overall, the refinance portion of mortgage activity increased to 41.9% total applications from 41.6% from the prior week. The adjustable-rate mortgage share of activity decreased to 8.2% of total applications. According to the MBA, the average contract interest rate for 30-year fixed-rate mortgages with a conforming loan balance was unchanged at 4.23% with points decreasing to 0.31 from 0.32. For the week, the FNMA 3.5% coupon bond gained 3.1 basis points to close at $102.63 while the 10-year Treasury yield decreased 2.48 basis points to end at 2.3257%. Stocks ended the week mixed. The Dow Jones Industrial Average fell 110.33 points to end at 20,896.61. The NASDAQ Composite Index gained 20.47 points to close at 6,121.23 and the S&P 500 Index lost 8.39 points to close at 2,390.39. Year to date, the Dow Jones Industrial Average has gained 5.74%, the NASDAQ Composite Index has advanced 13.71%, and the S&P 500 Index has risen 6.79%. This past week, the national average 30-year mortgage rate held steady at 4.09%; the 15-year mortgage rate was unchanged at 3.34%; the 5/1 ARM mortgage rate edged lower to 3.07% from 3.08%; and the FHA 30-year rate was unchanged at 3.85%. Jumbo 30-year rates were also unchanged at 4.36%.
Economic Calendar - for the Week of May 15, 2017 Economic reports having the greatest potential impact on the financial markets are highlighted in bold.
| Date | TimeET | Event /Report /Statistic | For | Market Expects | Prior |
| May 15 | 08:30 | NY Empire State Manufacturing Index | May | 7.5 | 5.2 |
| May 15 | 16:00 | Net Long-Term TIC Flows | May | NA | $53.4B |
| May 16 | 08:30 | Housing Starts | Apr | 1,255K | 1,215K |
| May 16 | 08:30 | Building Permits | Apr | 1,270K | 1,260K |
| May 16 | 09:15 | Industrial Production | Apr | 0.3% | 0.5% |
| May 16 | 09:15 | Capacity Utilization | Apr | 76.2% | 76.1% |
| May 17 | 07:00 | MBA Mortgage Applications Index | 05/13 | NA | 2.4% |
| May 17 | 10:30 | Crude Oil Inventories | 05/13 | NA | NA |
| May 18 | 08:30 | Initial Jobless Claims | 05/13 | 240,000 | 236,000 |
| May 18 | 08:30 | Continuing Jobless Claims | 05/06 | NA | 1,918K |
| May 18 | 08:30 | Philadelphia Fed Manufacturing Index | May | 18.5 | 22.0 |
| May 18 | 10:00 | Index of Leading Economic Indicators | Apr | 0.4% | 0.4% |
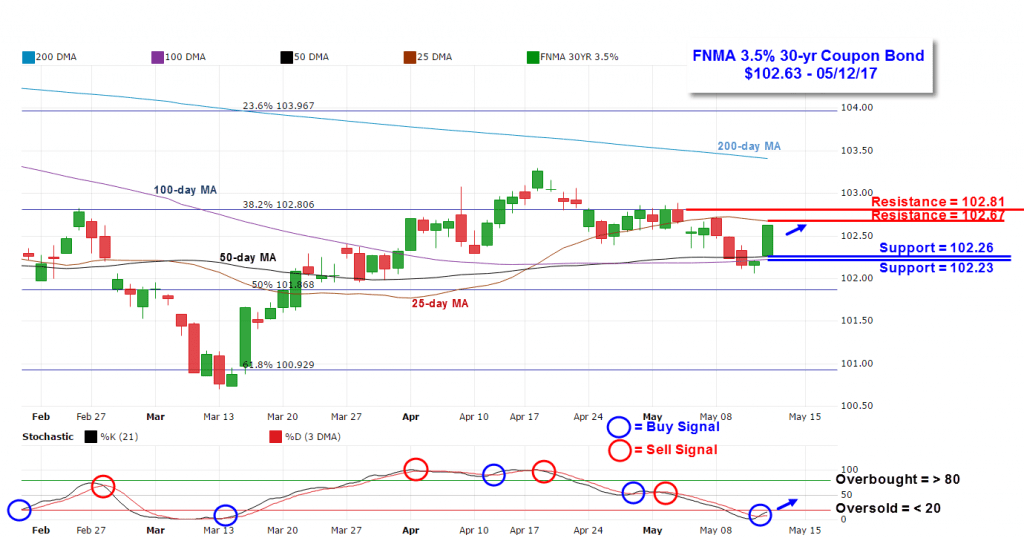
Mortgage Rate Forecast with Chart - FNMA 30-Year 3.5% Coupon Bond The FNMA 30-year 3.5% coupon bond ($102.63, +3.1 bp) traded within a 66 basis point range between a weekly intraday high of $102.72 on Monday and a weekly intraday low of $102.06 on Thursday before closing the week at $102.63. Mortgage bonds traded down for a test of support for most of the week before strongly springing back on Friday. Friday’s rebound triggered a new buy signal from a positive stochastic crossover from an “oversold” position. The bond should continue higher for a test of formidable resistance at the 25-day moving average at $102.67 and the 38.2% Fibonacci retracement level at $102.81. The bond will have to break above these levels in order for us to see a meaningful improvement in mortgage rates. If the bond is turned away from resistance, rates should remain close to present levels.