
The three major stock market indexes plus mortgage bonds ended the week modestly lower after strong economic data elevated fears of higher interest rates. The week’s solid economic data sent the yield on the benchmark 10-year Treasury note up to 3.12% on Thursday, its highest level in seven years. In economic news, the Commerce Department reported retail sales increased by 0.3% in April. Although this figure matched the consensus forecast, the government revised the sales data from February and March significantly higher. With current labor market trends driving up wage income at an annualized rate of about 4.5%, retail spending growth should continue to trend higher over the coming months. Furthermore, the New York Empire State and Philadelphia Fed Manufacturing Indexes for May both showed significantly more manufacturing growth than expected. There were several housing related reports released this past week. Tuesday, the National Association of Home Builders (NAHB) Housing Market Index (HMI), a gauge of builder opinion on the relative level of current and future single-family home sales, came in with a reading of 70 for May, slightly higher than the consensus forecast of 69 and April’s downwardly revised reading of 68. NAHB Chairman Randy Noel remarked “The solid May report shows that builders are buoyed by growing consumer demand for single-family homes. However, the record-high cost of lumber is hurting builders' bottom lines and making it more difficult to produce competitively priced houses for newcomers to the market.” Wednesday, the U.S. Census Bureau and the Department of Housing and Urban Development reported new Housing Starts in April reached a seasonally adjusted annual rate of 1.287 million. This was a decline of 3.7% from the upwardly revised March pace of 1.336 million but was an increase of 10.5% compared with the April 2017 rate of 1.165 million. The consensus forecast called for a rate of around 1.325 million for April. Meanwhile, the seasonally adjusted rate of new Building Permits fell to 1.352 million, down 1.8% from the upwardly revised February rate of 1.377 million, but 7.7% higher than the April 2017 rate. In the single-family home category, housing permits rose month over month in April from a revised annual rate of 851,000 in March to a seasonally adjusted annual rate of 859,000. The rate rose 7.9% year over year. Danielle Hale, chief economist for Realtor.com, had this to say about the report: “We saw 894,000 single-family housing starts in April, a slight step up from an upwardly revised March figure. We remain significantly behind a normal level of 1.2 million starts. In fact, if single-family starts continue at the strong yearly growth rate we saw in April, it will be fall 2019 before annual single-family starts break the 1 million mark consistently — which is still 17 percent lower than normal.” 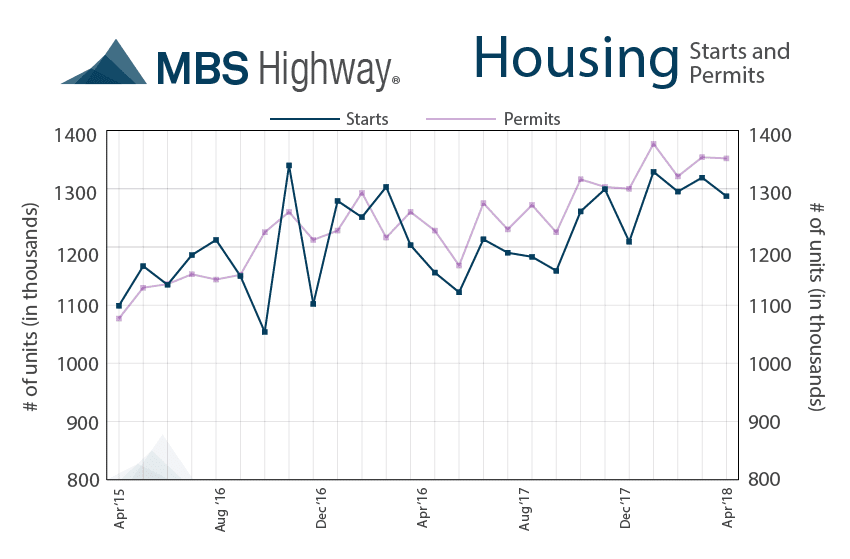 From the mortgage industry, the latest data from the Mortgage Bankers Association’s (MBA) weekly mortgage applications survey showed a drop in mortgage applications. The MBA reported their overall seasonally adjusted Market Composite Index (application volume) decreased 2.7% during the week ended May 11, 2018. The seasonally adjusted Purchase Index fell 2.0% from the week prior while the Refinance Index decreased by 4.0% to its lowest level since August 2008. Overall, the refinance portion of mortgage activity fell to 35.9% from 36.3% of total applications from the prior week, its lowest level since September 2008. The adjustable-rate mortgage share of activity was unchanged at 6.5% of total applications. According to the MBA, the average contract interest rate for 30-year fixed-rate mortgages with a conforming loan balance decreased to 4.77% from 4.78% with points decreasing to 0.35 from 0.36. For the week, the FNMA 4.0% coupon bond lost 39.0 basis points to close at $101.266 while the 10-year Treasury yield increased 9.05 basis points to end at 3.06%. The three major stock indexes ended lower for the week. The Dow Jones Industrial Average fell 116.08 points to close at 24,715.09. The NASDAQ Composite Index dropped 48.54 points to close at 7,354.34. The S&P 500 Index lost 14.75 points to close at 2,712.97. Year to date on a total return basis, the Dow Jones Industrial Average has dropped 0.02%, the NASDAQ Composite Index has gained 6.53%, and the S&P 500 Index has advanced 1.47%. This past week, the national average 30-year mortgage rate increased to 4.78% from 4.65%; the 15-year mortgage rate rose to 4.21% from 4.05%; the 5/1 ARM mortgage rate increased to 4.00% from 3.84% while the FHA 30-year rate rose to 4.50% from 4.45%. Jumbo 30-year rates increased to 4.80% from 4.68%. Economic Calendar - for the Week of May 21, 2018 Economic reports having the greatest potential impact on the financial markets are highlighted in bold.
 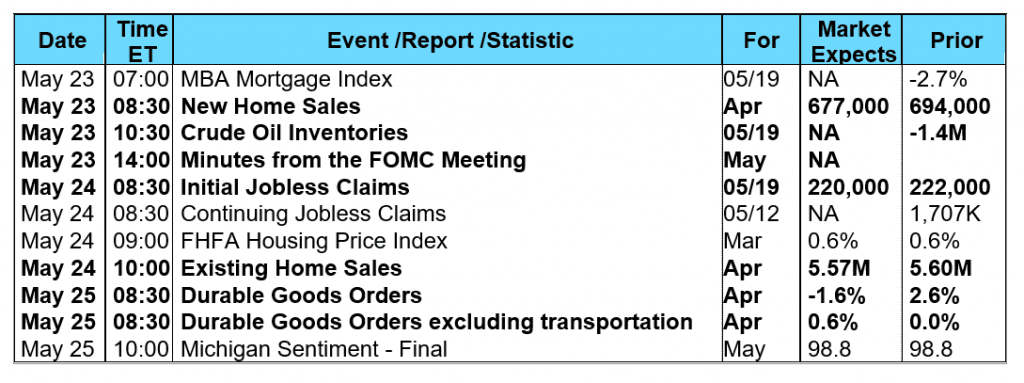 Mortgage Rate Forecast with Chart - FNMA 30-Year 4.0% Coupon Bond The FNMA 30-year 4.0% coupon bond ($101.266, -39.0 bp) traded within a wider 98.1 basis point range between a weekly intraday high of 101.641 on Monday and a weekly intraday low of $100.66 on Thursday before closing the week at $101.266 on Friday. The bond had a positive bounce off of support on Thursday and Friday from a deeply oversold position resulting in a positive stochastic crossover buy signal. From a technical perspective, the bond should trade up for a test of overhead resistance in the coming week, and should this happen; mortgage rates should undergo a slight improvement.
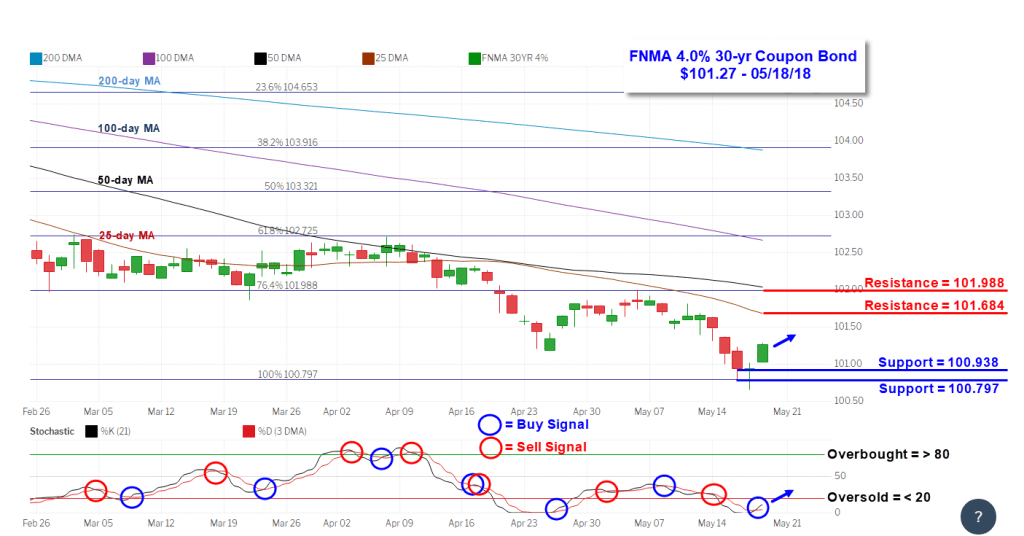
From the mortgage industry, the latest data from the Mortgage Bankers Association’s (MBA) weekly mortgage applications survey showed a drop in mortgage applications. The MBA reported their overall seasonally adjusted Market Composite Index (application volume) decreased 2.7% during the week ended May 11, 2018. The seasonally adjusted Purchase Index fell 2.0% from the week prior while the Refinance Index decreased by 4.0% to its lowest level since August 2008. Overall, the refinance portion of mortgage activity fell to 35.9% from 36.3% of total applications from the prior week, its lowest level since September 2008. The adjustable-rate mortgage share of activity was unchanged at 6.5% of total applications. According to the MBA, the average contract interest rate for 30-year fixed-rate mortgages with a conforming loan balance decreased to 4.77% from 4.78% with points decreasing to 0.35 from 0.36. For the week, the FNMA 4.0% coupon bond lost 39.0 basis points to close at $101.266 while the 10-year Treasury yield increased 9.05 basis points to end at 3.06%. The three major stock indexes ended lower for the week. The Dow Jones Industrial Average fell 116.08 points to close at 24,715.09. The NASDAQ Composite Index dropped 48.54 points to close at 7,354.34. The S&P 500 Index lost 14.75 points to close at 2,712.97. Year to date on a total return basis, the Dow Jones Industrial Average has dropped 0.02%, the NASDAQ Composite Index has gained 6.53%, and the S&P 500 Index has advanced 1.47%. This past week, the national average 30-year mortgage rate increased to 4.78% from 4.65%; the 15-year mortgage rate rose to 4.21% from 4.05%; the 5/1 ARM mortgage rate increased to 4.00% from 3.84% while the FHA 30-year rate rose to 4.50% from 4.45%. Jumbo 30-year rates increased to 4.80% from 4.68%. Economic Calendar - for the Week of May 21, 2018 Economic reports having the greatest potential impact on the financial markets are highlighted in bold. Mortgage Rate Forecast with Chart - FNMA 30-Year 4.0% Coupon Bond The FNMA 30-year 4.0% coupon bond ($101.266, -39.0 bp) traded within a wider 98.1 basis point range between a weekly intraday high of 101.641 on Monday and a weekly intraday low of $100.66 on Thursday before closing the week at $101.266 on Friday. The bond had a positive bounce off of support on Thursday and Friday from a deeply oversold position resulting in a positive stochastic crossover buy signal. From a technical perspective, the bond should trade up for a test of overhead resistance in the coming week, and should this happen; mortgage rates should undergo a slight improvement.