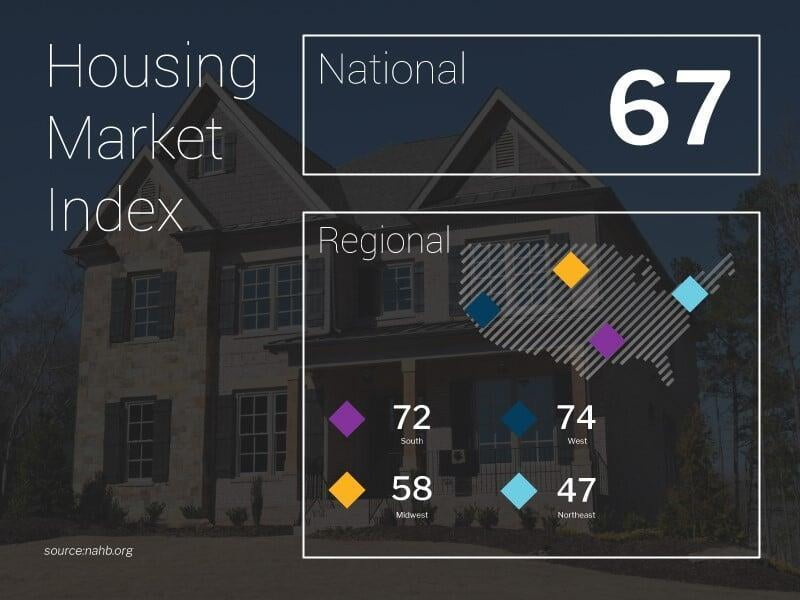
The stock market turned in a “mixed” performance while mortgage bonds and treasuries traded essentially flat on the week. Both the Dow Jones Industrial Average and S&P 500 were able to advance while the technology-heavy NASDAQ Composite Index posted a modest loss. Equity markets were influenced by continuing volatility in emerging market currencies, the Turkish Lira in particular. Other factors included news of renewed trade negotiations between the U.S. and China and economic news of solid retail sales. Thursday and Friday, reports surfaced that the U.S. and China will resume trade negotiations by the end of August. U.S. and Chinese trade negotiators reportedly now have a goal of ending their trade disagreements ahead of multilateral meetings between President Trump and President Xi of China scheduled for November. In economic news, the Commerce Department reported Retail Sales increased a robust 0.5% in July to easily surpass the consensus forecast of +0.1% and a downwardly revised 0.2% gain in June. Core Retail Sales, sales excluding autos, gas stations, and building materials stores, rose by an even greater 0.6% and were driven by healthy spending at clothing stores, restaurants and bars, and online purchases. Last Wednesday in housing, the National Association of Home Builders (NAHB) reported their Housing Market Index (HMI), a gauge of builder opinion on the relative level of current and future single-family home sales, fell slightly lower for August to 67 from last month’s reading of 68. Readings above 50 indicate a favorable outlook on home sales while those below 50 indicate a negative outlook. NAHB chairman Randy Noel had this to say “The good news is that builders continue to report strong demand for new housing, fueled by steady job and income growth along with rising household formations. However, they are increasingly focused on growing affordability concerns, stemming from rising construction costs, shortages of skilled labor and a dearth of buildable lots.”  On Thursday, the Commerce Department reported Housing Starts increased 0.9% in July to a seasonally adjusted annual rate of 1.168 million. This was below the consensus forecast of 1.256 million and followed a downwardly revised 1.158 million from an initially reported 1.173 million for June. However, Building Permits increased 1.5% to 1.311 million. Although the Permits number was slightly below the consensus forecast of 1.316 million, June’s number was revised higher to 1.292 million from an originally reported 1.273 million. Permits for single-family units increased 1.9% to 869,000 while Permits for multi-unit dwellings increased 0.7% to 442,000. Regionally, single-family starts were 5.7% lower in the Northeast, 22.3% higher in the Midwest, 2.0% higher in the South, and 10.0% lower in the West. The number of units under construction at the end of July totaled 1.122 million units. This is slightly below the second quarter average of 1.123 million, suggesting a slightly negative influence on third quarter GDP forecasts.
  Overall, the fact that single-family starts increased by only 0.9% to 862,000 likely reflect some of the difficulties home builders are facing with higher costs for land, materials, and skilled construction labor. Elsewhere, the latest data from the Mortgage Bankers Association’s (MBA) weekly mortgage applications survey showed another decrease in mortgage applications. The MBA reported their overall seasonally adjusted Market Composite Index (application volume) fell 2.0% during the week ended August 10, 2018. The seasonally adjusted Purchase Index dropped 3.0% from the week prior while the Refinance Index remained unchanged from a week earlier. Overall, the refinance portion of mortgage activity increased to 37.6% from 36.6% of total applications from the prior week. The adjustable-rate mortgage share of activity decreased to 6.2% from 6.3% of total applications. According to the MBA, the average contract interest rate for 30-year fixed-rate mortgages with a conforming loan balance dropped to 4.81% from 4.84% with points decreasing to 0.43 from 0.45 for 80 percent loan-to-value ratio (LTV) loans. For the week, the FNMA 4.0% coupon bond gained 1.5 basis points to close at $101.828 while the 10-year Treasury yield decreased 0.90 of one basis point to end at 2.864%. The Dow Jones Industrial Average gained 356.18 points to close at 25,669.32. The NASDAQ Composite Index fell 22.78 points to close at 7,816.33. The S&P 500 Index added 16.85 points to close at 2,850.13. Year to date on a total return basis, the Dow Jones Industrial Average has gained 3.84%, the NASDAQ Composite Index has advanced 13.22%, and the S&P 500 Index has added 6.60%. This past week, the national average 30-year mortgage rate remained unchanged at 4.64; the 15-year mortgage rate rose to 4.14% from 4.13%; the 5/1 ARM mortgage rate increased to 3.97% from 3.95% while the FHA 30-year rate remained unchanged at 4.37%. Jumbo 30-year rates eased to 4.37% from 4.40%. Economic Calendar - for the Week of August 20, 2018 Economic reports having the greatest potential impact on the financial markets are highlighted in bold.
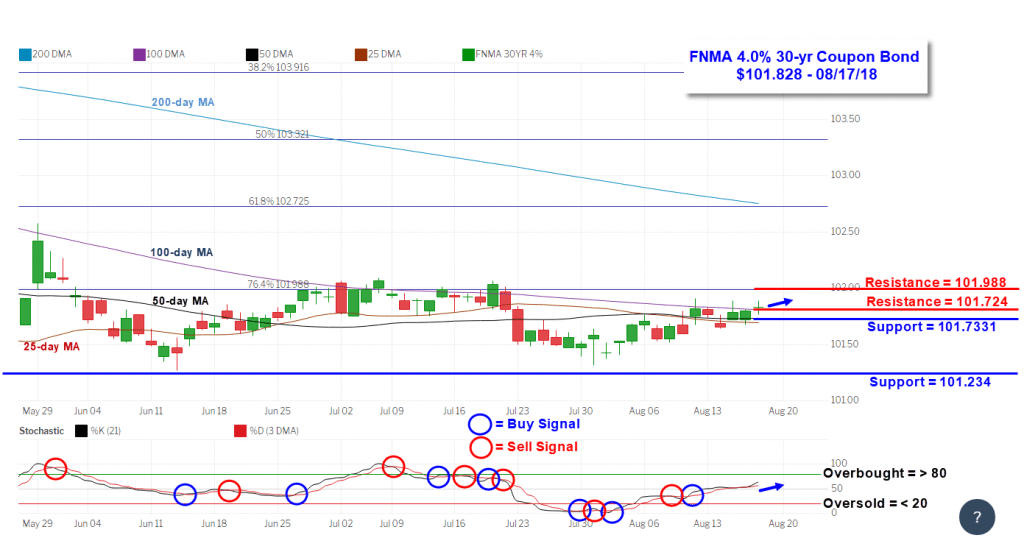
  Mortgage Rate Forecast with Chart - FNMA 30-Year 4.0% Coupon Bond The FNMA 30-year 4.0% coupon bond ($101.828, +1.50 bp) traded within a narrow 25.0 basis point range between a weekly intraday low of 101.641 on Tuesday and a weekly intraday high of $101.891 on Wednesday and Friday before closing the week at $101.828 on Friday. Mortgage bond prices retreated slightly on Monday and Tuesday before recovering essentially to where they began the week during Wednesday through Friday. Prices are trending along a convergence of the 25-day, 50-day, and 100-day moving averages that act both as technical support and resistance. The bond is neither “overbought” nor “oversold” while remaining on a ‘buy” signal so we could likely see more of the same recent pattern where prices trend in a sideways direction with the above-mentioned major moving averages. Continue to look for stable to slightly improved mortgage rates this coming week.
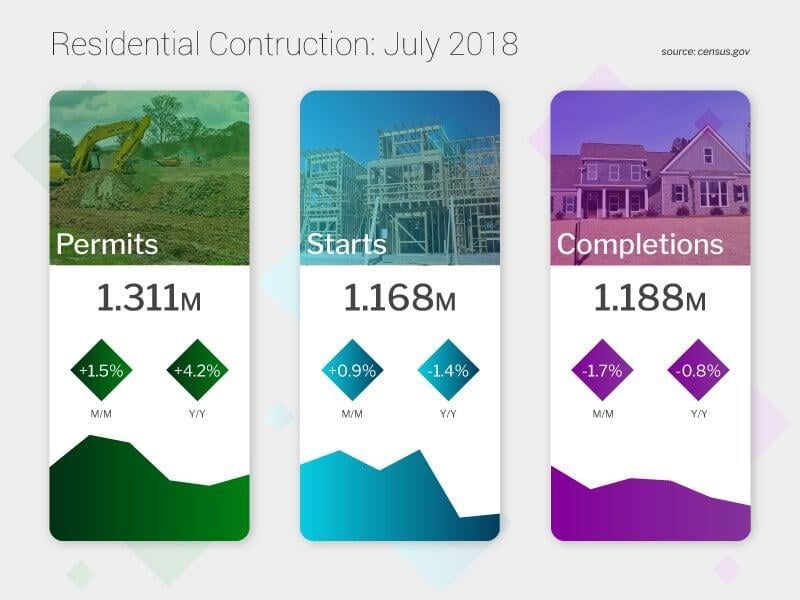
 On Thursday, the Commerce Department reported Housing Starts increased 0.9% in July to a seasonally adjusted annual rate of 1.168 million. This was below the consensus forecast of 1.256 million and followed a downwardly revised 1.158 million from an initially reported 1.173 million for June. However, Building Permits increased 1.5% to 1.311 million. Although the Permits number was slightly below the consensus forecast of 1.316 million, June’s number was revised higher to 1.292 million from an originally reported 1.273 million. Permits for single-family units increased 1.9% to 869,000 while Permits for multi-unit dwellings increased 0.7% to 442,000. Regionally, single-family starts were 5.7% lower in the Northeast, 22.3% higher in the Midwest, 2.0% higher in the South, and 10.0% lower in the West. The number of units under construction at the end of July totaled 1.122 million units. This is slightly below the second quarter average of 1.123 million, suggesting a slightly negative influence on third quarter GDP forecasts.
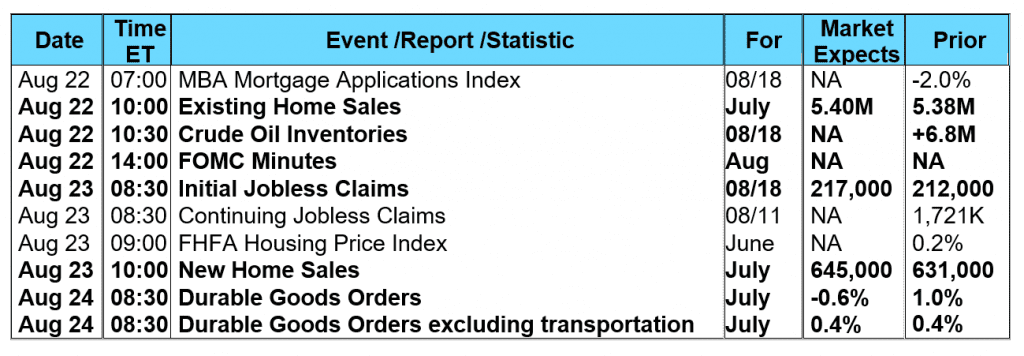
  Overall, the fact that single-family starts increased by only 0.9% to 862,000 likely reflect some of the difficulties home builders are facing with higher costs for land, materials, and skilled construction labor. Elsewhere, the latest data from the Mortgage Bankers Association’s (MBA) weekly mortgage applications survey showed another decrease in mortgage applications. The MBA reported their overall seasonally adjusted Market Composite Index (application volume) fell 2.0% during the week ended August 10, 2018. The seasonally adjusted Purchase Index dropped 3.0% from the week prior while the Refinance Index remained unchanged from a week earlier. Overall, the refinance portion of mortgage activity increased to 37.6% from 36.6% of total applications from the prior week. The adjustable-rate mortgage share of activity decreased to 6.2% from 6.3% of total applications. According to the MBA, the average contract interest rate for 30-year fixed-rate mortgages with a conforming loan balance dropped to 4.81% from 4.84% with points decreasing to 0.43 from 0.45 for 80 percent loan-to-value ratio (LTV) loans. For the week, the FNMA 4.0% coupon bond gained 1.5 basis points to close at $101.828 while the 10-year Treasury yield decreased 0.90 of one basis point to end at 2.864%. The Dow Jones Industrial Average gained 356.18 points to close at 25,669.32. The NASDAQ Composite Index fell 22.78 points to close at 7,816.33. The S&P 500 Index added 16.85 points to close at 2,850.13. Year to date on a total return basis, the Dow Jones Industrial Average has gained 3.84%, the NASDAQ Composite Index has advanced 13.22%, and the S&P 500 Index has added 6.60%. This past week, the national average 30-year mortgage rate remained unchanged at 4.64; the 15-year mortgage rate rose to 4.14% from 4.13%; the 5/1 ARM mortgage rate increased to 3.97% from 3.95% while the FHA 30-year rate remained unchanged at 4.37%. Jumbo 30-year rates eased to 4.37% from 4.40%. Economic Calendar - for the Week of August 20, 2018 Economic reports having the greatest potential impact on the financial markets are highlighted in bold.
  Mortgage Rate Forecast with Chart - FNMA 30-Year 4.0% Coupon Bond The FNMA 30-year 4.0% coupon bond ($101.828, +1.50 bp) traded within a narrow 25.0 basis point range between a weekly intraday low of 101.641 on Tuesday and a weekly intraday high of $101.891 on Wednesday and Friday before closing the week at $101.828 on Friday. Mortgage bond prices retreated slightly on Monday and Tuesday before recovering essentially to where they began the week during Wednesday through Friday. Prices are trending along a convergence of the 25-day, 50-day, and 100-day moving averages that act both as technical support and resistance. The bond is neither “overbought” nor “oversold” while remaining on a ‘buy” signal so we could likely see more of the same recent pattern where prices trend in a sideways direction with the above-mentioned major moving averages. Continue to look for stable to slightly improved mortgage rates this coming week.
