
Trade-related news dominated investor sentiment during the week. Last Monday, news of a bilateral trade agreement between the U.S. and Mexico propelled several stock indexes to new all-time highs including the Nasdaq Composite and S&P 500 indices. With stocks making new highs, bond prices failed to gain much traction with the yield on the benchmark 10-year Treasury note rising slightly during the week. Following news of the trade deal between Mexico and the U.S., Canada entered trade discussions with the U.S. but was unable to conclude a new trade deal by a Friday deadline. Negotiations are scheduled to resume this coming week. In other trade news Thursday, President Trump announced he would move ahead with tariffs on $200 billion worth of Chinese goods as early as this coming week and also said in a Bloomberg interview that the European Union's (EU) offer to eliminate auto tariffs was “not good enough” and compared the EU's trade policies to those of China. This tough talk on trade by the president is a negotiating tactic and it will be interesting to see the ultimate outcomes when trade deals are finalized between the U.S. and the EU and China. There were several housing-related news releases during the week. Tuesday, the latest Case-Shiller Home Price Index from S&P Dow Jones Indices and CoreLogic showed home prices nationwide increased 6.2% for the year through June 2018. However, this is lower than May’s reading of a 6.4% price gain for the year. Average home prices for the top 10 metropolitan areas increased 6% and the 20-city composite saw a 6.3% year-over-year gain. 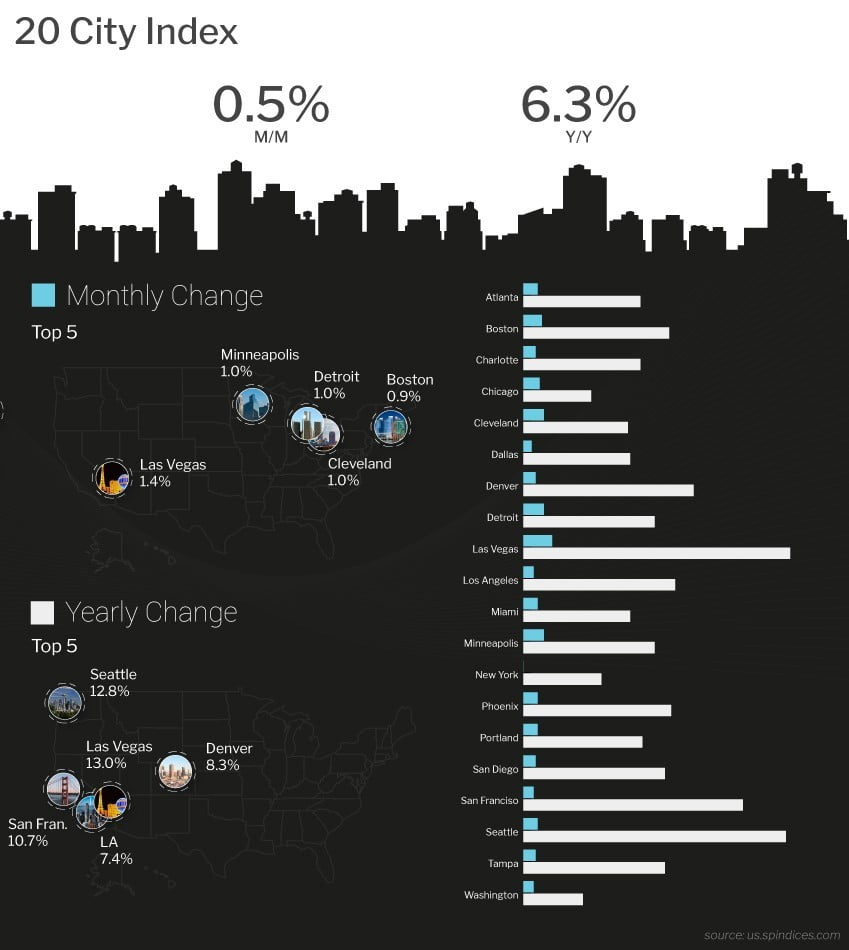 David Blitzer, managing director and chairman of the Index Committee at S&P Dow Jones Indices, remarked “Home prices continue to rise across the U.S. However, even as home prices keep climbing, we are seeing signs that growth is easing in the housing market. Sales of both new and existing homes are roughly flat over the last six months amidst news stories of an increase in the number of homes for sale in some markets.” Seattle, Las Vegas and San Francisco continue to have the highest year-over-year gains among all cities in the 20-city index. Las Vegas took the lead from Seattle with a year-over-year price increase of 13% to Seattle’s 12.8% price increase while San Francisco saw an increase of 10.7%. Wednesday, the National Association of Realtors (NAR) reported Pending Home Sales fell on an annual basis for the seventh consecutive month in July. The NAR’s Pending Home Sales Index, a forward-looking indicator based on contract signings, dropped 0.7% in July to 106.2, down from 107 in June. With June’s decline, the index is down 2.3%. NAR Chief Economist Lawrence Yun stated “Contract signings inched backward once again last month, as declines in the South and West weighed down on overall activity. It’s evident in recent months that many of the most overheated real estate markets – especially those out West – are starting to see a slight decline in home sales and slower price growth. The reason sales are falling off last year’s pace is that multiple years of inadequate supply in markets with strong job growth have finally driven up home prices to a point where an increasing number of prospective buyers are unable to afford it.”
 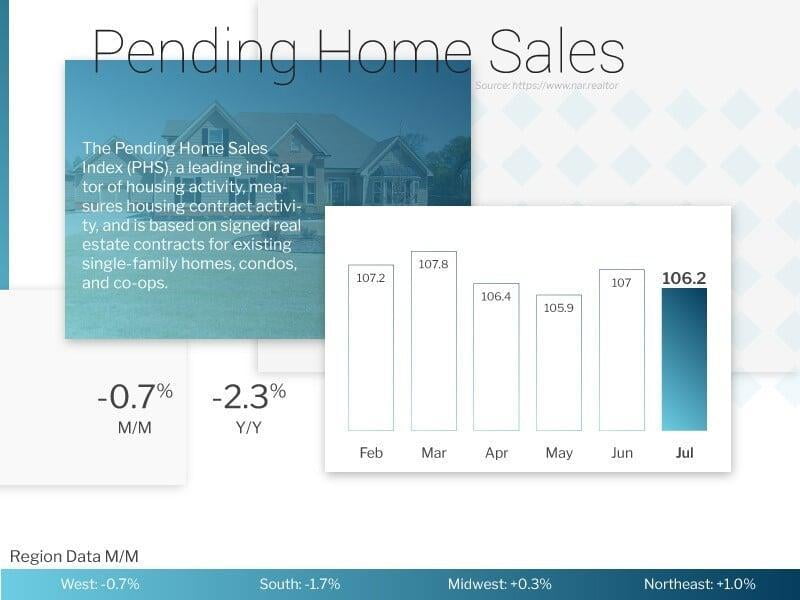 Elsewhere, the latest data from the Mortgage Bankers Association’s (MBA) weekly mortgage applications survey showed a decline in mortgage applications. The MBA reported their overall seasonally adjusted Market Composite Index (application volume) fell 1.7% during the week ended August 24, 2018. The seasonally adjusted Purchase Index decreased 1.0% from the week prior while the Refinance Index fell 3.0% from a week earlier. Overall, the refinance portion of mortgage activity remained unchanged at 38.7% of total applications from the prior week. The adjustable-rate mortgage share of activity decreased to 6.3% from 6.5% of total applications. According to the MBA, the average contract interest rate for 30-year fixed-rate mortgages with a conforming loan balance decreased to 4.78% from 4.81% (the lowest rate since the week ended July 20, 2018) with points increasing to 0.46 from 0.42 for 80 percent loan-to-value ratio (LTV) loans. For the week, the FNMA 4.0% coupon bond lost 17.1 basis points to close at $101.813 while the 10-year Treasury yield increased 4.70 basis points to end at 2.860%. The Dow Jones Industrial Average gained 174.47 points to close at 25,964.82. The NASDAQ Composite Index advanced 163.56 points to close at 8,109.54. The S&P 500 Index added 26.83 points to close at 2,901.52. Year to date on a total return basis, the Dow Jones Industrial Average has gained 5.04%, the NASDAQ Composite Index has advanced 17.47%, and the S&P 500 Index has added 8.52%. This past week, the national average 30-year mortgage rate rose to 4.65% from 4.63%; the 15-year mortgage rate increased to 4.15% from 4.14%; the 5/1 ARM mortgage rate increased to 3.98% from 3.95% while the FHA 30-year rate remained unchanged at 4.37%. Jumbo 30-year rates eased to 4.33% from 4.34%. Economic Calendar - for the Week of September 3, 2018 Economic reports having the greatest potential impact on the financial markets are highlighted in bold.
 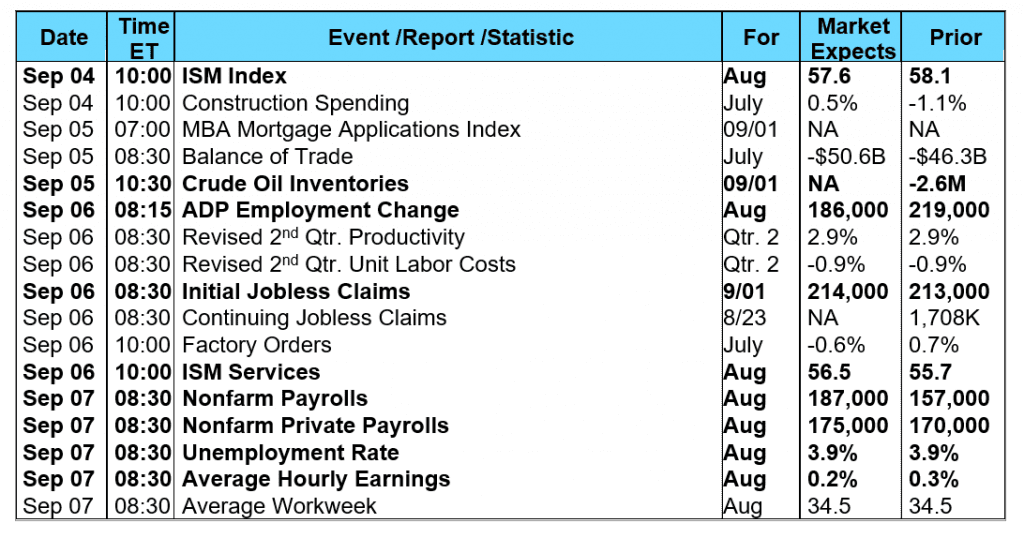 Mortgage Rate Forecast with Chart - FNMA 30-Year 4.0% Coupon Bond The FNMA 30-year 4.0% coupon bond ($101.813, -17.1 bp) traded within a slightly wider 29.7 basis point range between a weekly intraday high of 101.953 on Monday and a weekly intraday low of $101.656 on Wednesday before closing the week at $101.813 on Friday. Mortgage bond prices took a dip lower to test a solid, triple layer of support Monday through Wednesday from the prior week’s extremely “overbought” position. Prices then bounced just above the triple support layer formed from the convergence of the 25-day (101.727), 100-day (101.745) and 50-day (101.784) moving averages on Thursday and Friday. Mortgage bonds are no longer “overbought” and prices appear ready to continue higher from support. However, a stubborn resistance level found at the 76.4% Fibonacci retracement level at $101.988 has put a manhole cover over any meaningful advances since last May. This has resulted in bond prices getting squeezed between support and resistance forcing a mostly sideways direction in the market. This action should continue this week with minimal effect on mortgage rates.
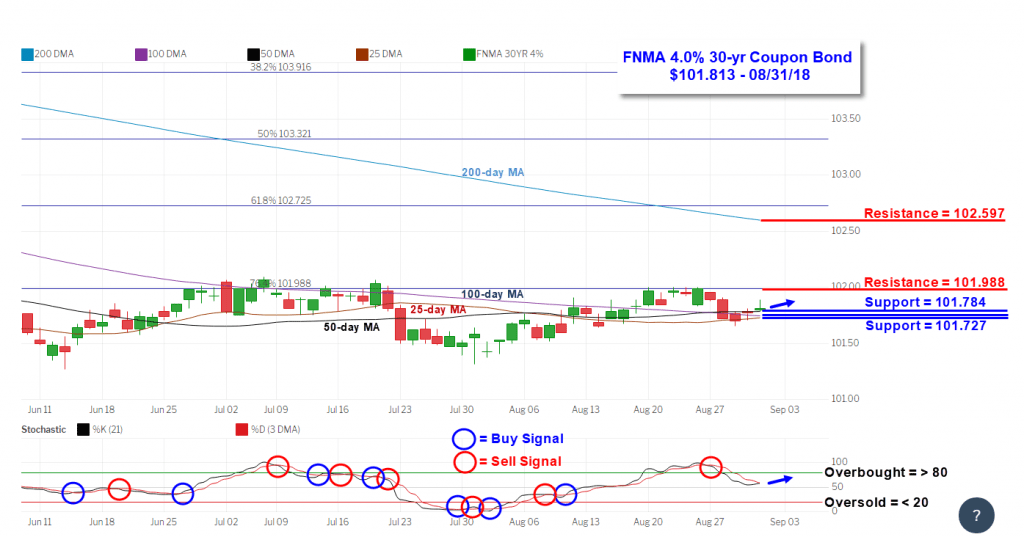
David Blitzer, managing director and chairman of the Index Committee at S&P Dow Jones Indices, remarked “Home prices continue to rise across the U.S. However, even as home prices keep climbing, we are seeing signs that growth is easing in the housing market. Sales of both new and existing homes are roughly flat over the last six months amidst news stories of an increase in the number of homes for sale in some markets.” Seattle, Las Vegas and San Francisco continue to have the highest year-over-year gains among all cities in the 20-city index. Las Vegas took the lead from Seattle with a year-over-year price increase of 13% to Seattle’s 12.8% price increase while San Francisco saw an increase of 10.7%. Wednesday, the National Association of Realtors (NAR) reported Pending Home Sales fell on an annual basis for the seventh consecutive month in July. The NAR’s Pending Home Sales Index, a forward-looking indicator based on contract signings, dropped 0.7% in July to 106.2, down from 107 in June. With June’s decline, the index is down 2.3%. NAR Chief Economist Lawrence Yun stated “Contract signings inched backward once again last month, as declines in the South and West weighed down on overall activity. It’s evident in recent months that many of the most overheated real estate markets – especially those out West – are starting to see a slight decline in home sales and slower price growth. The reason sales are falling off last year’s pace is that multiple years of inadequate supply in markets with strong job growth have finally driven up home prices to a point where an increasing number of prospective buyers are unable to afford it.” Elsewhere, the latest data from the Mortgage Bankers Association’s (MBA) weekly mortgage applications survey showed a decline in mortgage applications. The MBA reported their overall seasonally adjusted Market Composite Index (application volume) fell 1.7% during the week ended August 24, 2018. The seasonally adjusted Purchase Index decreased 1.0% from the week prior while the Refinance Index fell 3.0% from a week earlier. Overall, the refinance portion of mortgage activity remained unchanged at 38.7% of total applications from the prior week. The adjustable-rate mortgage share of activity decreased to 6.3% from 6.5% of total applications. According to the MBA, the average contract interest rate for 30-year fixed-rate mortgages with a conforming loan balance decreased to 4.78% from 4.81% (the lowest rate since the week ended July 20, 2018) with points increasing to 0.46 from 0.42 for 80 percent loan-to-value ratio (LTV) loans. For the week, the FNMA 4.0% coupon bond lost 17.1 basis points to close at $101.813 while the 10-year Treasury yield increased 4.70 basis points to end at 2.860%. The Dow Jones Industrial Average gained 174.47 points to close at 25,964.82. The NASDAQ Composite Index advanced 163.56 points to close at 8,109.54. The S&P 500 Index added 26.83 points to close at 2,901.52. Year to date on a total return basis, the Dow Jones Industrial Average has gained 5.04%, the NASDAQ Composite Index has advanced 17.47%, and the S&P 500 Index has added 8.52%. This past week, the national average 30-year mortgage rate rose to 4.65% from 4.63%; the 15-year mortgage rate increased to 4.15% from 4.14%; the 5/1 ARM mortgage rate increased to 3.98% from 3.95% while the FHA 30-year rate remained unchanged at 4.37%. Jumbo 30-year rates eased to 4.33% from 4.34%. Economic Calendar - for the Week of September 3, 2018 Economic reports having the greatest potential impact on the financial markets are highlighted in bold. Mortgage Rate Forecast with Chart - FNMA 30-Year 4.0% Coupon Bond The FNMA 30-year 4.0% coupon bond ($101.813, -17.1 bp) traded within a slightly wider 29.7 basis point range between a weekly intraday high of 101.953 on Monday and a weekly intraday low of $101.656 on Wednesday before closing the week at $101.813 on Friday. Mortgage bond prices took a dip lower to test a solid, triple layer of support Monday through Wednesday from the prior week’s extremely “overbought” position. Prices then bounced just above the triple support layer formed from the convergence of the 25-day (101.727), 100-day (101.745) and 50-day (101.784) moving averages on Thursday and Friday. Mortgage bonds are no longer “overbought” and prices appear ready to continue higher from support. However, a stubborn resistance level found at the 76.4% Fibonacci retracement level at $101.988 has put a manhole cover over any meaningful advances since last May. This has resulted in bond prices getting squeezed between support and resistance forcing a mostly sideways direction in the market. This action should continue this week with minimal effect on mortgage rates.