The major stock market indexes reversed the prior week’s losses and moved higher for the week to reach their highest levels in several months while bond prices slipped a little lower, though mortgage rates were mostly unchanged for the week. The large and mid-cap indexes reached new 2016 highs, but the week’s gains were not sufficient to the drive the Nasdaq Composite and small-cap Russell 2000 Indexes into positive territory for the year. The gain in the stock market appeared to be due to three key factors during the week. First, news of an agreement on Tuesday between Saudi Arabia and Russia to waive Iranian participation (which was unlikely anyway) into any coordinated deal to freeze crude oil production helped send oil and stock prices higher. Oil prices reached their highest level since early December. This past Sunday, OPEC members and other major oil producers including Russia met in Doha, Qatar to hammer out an agreement to freeze production at current levels, but doubts still remain about such an agreement’s effectiveness in solving the global oil surplus. The other two factors favorable to stocks were favorable economic data reported from China and better than forecast first-quarter corporate earnings results from investment bank JPMorgan. China’s reported some inflation data below consensus forecasts raising investor expectations that China’s central bank may well implement another round of monetary stimulus to boost the world’s second largest economy. Also, China reported their first quarter GDP grew by 6.7% from a year ago to attain China’s official 6.5% to 7.0% growth target established in February. As for JPMorgan, the bank’s profits fell due to having to add assets to its reserves to offset losses in its energy loan portfolio and on low lending margins, but the profit decline was significantly less than many analysts had feared. In housing, CoreLogic® released its National Foreclosure Report for February showing foreclosure inventory fell 23.9% while completed foreclosures dropped 10% compared with data from February 2015. The February 2016 foreclosure inventory rate is the lowest for any month since November 2007. National foreclosure inventory included about 434,000, or 1.1% of all homes with a mortgage compared with 571,000 homes, or 1.5% for February 2015. The number of mortgages in serious delinquency fell 19.9% from February 2015 to February 2016, with 1.3 million mortgages, or 3.2% remaining in this category, the lowest percentage in eight years. As for mortgages, the Mortgage Bankers Association (MBA) released their latest Mortgage Application Data for the week ending April 8
th showing the overall seasonally adjusted Market Composite Index increased 10.0%. The seasonally adjusted Purchase Index increased 8.0%, its second highest level since May 2010, while the Refinance Index increased 11.0%. Overall, the refinance portion of mortgage activity increased to 54.9% of total applications from 54.5%. The adjustable-rate mortgage share of activity was 5.0%, an increase of 0.3% from 4.7% the previous week. According to the MBA, the average contract interest rate for 30-year fixed-rate mortgages with conforming loan balance fell from 3.86% to 3.82% with 0.33 points paid. For the week, the FNMA 3.0% coupon bond lost 28.1 basis points to end at $102.63 while the 10-year Treasury yield increased 3.7 basis points to end at 1.7535%. Stocks ended the week with the Dow Jones Industrial Average gaining 320.50 points to end at 17,897.46. The NASDAQ Composite Index added 87.53 points to close at 4,938.22, and the S&P 500 Index advanced 33.13 points to close at 2,080.73. Year to date, and exclusive of any dividends, the Dow Jones Industrial Average has gained 2.64%, the NASDAQ Composite Index has lost 1.40%, and the S&P 500 Index has gained 1.77%. This past week, the national average 30-year mortgage rate was unchanged at 3.64% while the 15-year mortgage rate also was unchanged at 2.94%. The 5/1 ARM mortgage rate remained unchanged at 2.97%. FHA 30-year rates held steady at 3.25% and Jumbo 30-year rates increased to 3.58% from 3.55%.
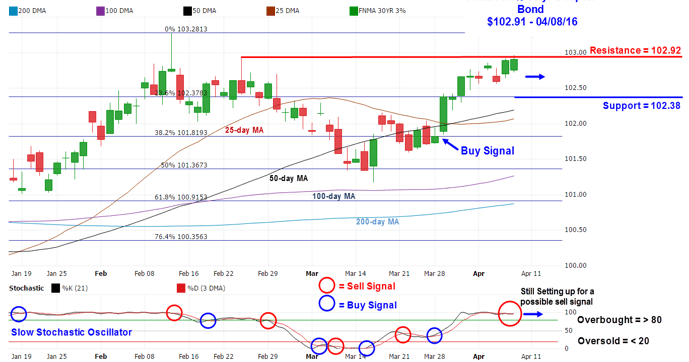
Mortgage Rate Forecast with Chart For the week, the FNMA 30-year 3.0% coupon bond ($102.63, -28.1 bp) traded within a wider 59 basis point range between a weekly intraday low of $102.41 and a weekly intraday high of 103.00 before closing at $102.63 on Friday. The bond trended lower from Monday through Thursday before bouncing back off of its weekly low on Friday. On Friday, the bond opened higher in a small “rising window” or upward gap to complete the formation of a three-day Morning Star candlestick pattern, a moderately powerful buy signal. Follow-through this coming week could send the bond higher for a test of resistance at the $102.92 level which has shown to be a tough ceiling of resistance. Support remains at the 23.6% Fibonacci retracement level at $102.36. With Friday’s upward move, the slow stochastic oscillator could be setting up for a potential positive crossover, and should this happen it would be another buy signal for bonds that may lead to a slight improvement in mortgage rates.
Chart: FNMA 30-Year 3.0% Coupon Bond
Economic Calendar - for the Week of April 18, 2016 The economic calendar this week features a number of reports focusing on the current status of the Housing Sector. Other reports of interest include weekly Initial Jobless Claims and the Philadelphia Fed Manufacturing Index. Economic reports having the greatest potential impact on the financial markets are highlighted in bold.
| Date | TimeET | Event /Report /Statistic | For | Market Expects | Prior |
| Apr 18 | 10:00 | NAHB Housing Market Index | Apr | 59 | 58 |
| Apr 19 | 08:30 | Building Permits | Mar | 1200K | 1167K |
| Apr 19 | 08:30 | Housing Starts | Mar | 1170K | 1178K |
| Apr 20 | 07:00 | MBA Mortgage Index | 04/16 | NA | NA |
| Apr 20 | 10:00 | Existing Home Sales | Mar | 5.30M | 5.08M |
| Apr 20 | 10:30 | Crude Oil Inventories | 04/16 | NA | 6.634M |
| Apr 21 | 08:30 | Initial Jobless Claims | 04/16 | 263K | 253K |
| Apr 21 | 08:30 | Continuing Jobless Claims | 04/09 | NA | 2171K |
| Apr 21 | 08:30 | Philadelphia Fed Manufacturing Index | Apr | 9.9 | 12.4 |
| Apr 21 | 09:00 | FHFA Housing Price Index | Feb | NA | 0.5% |
| Upcoming Federal Reserve FOMC Meeting Schedule & Rate Hike Probability ** |
| April 2016 | 26-27, (Tuesday-Wednesday) | 2% Chance |
| June 2016 | 14-15, (Tuesday-Wednesday)* | 13% Chance |
| July 2016 | 26-27, (Tuesday-Wednesday) | 28% Chance |
| September 2016 | 20-21, (Tuesday-Wednesday)* | 36% Chance |
| November 2016 | 1-2, (Tuesday-Wednesday) | 40% Chance |
| December 2016 | 20-21 (Tuesday-Wednesday)* | 52% Chance |
| February 2017 | 01/31-02/01 (Tuesday-Wednesday)* | 55% Chance |
* Meeting associated with a Summary of Economic Projections and a press conference by the Chairman.** Probability generated from the CME Group FedWatch tool based on the 30-day Fed Funds futures prices.