Bond and stock prices saw an increase in volatility this past week, rising early in the week before plunging over Thursday and Friday. Treasury yields jumped on expectations for higher rates. The yield on the 10-year Treasury note reached its highest level since June as prices fell. A surprising contraction in the Institute for Supply Management’s (ISM) Services Index propelled both bond and stock prices higher on Tuesday as traders felt the disappointing report would make the Federal Reserve less likely to raise interest rates at its upcoming meeting on September 21. The ISM reported their Services Index retreated to 51.4 in August from July’s reading of 55.5. The August ISM Services Index was the lowest since February 2010. Digging a little deeper into the report showed the Business Activity Index falling considerably lower to 51.8 in August from 59.3 in July. The New Orders Index also fell substantially to 51.4 from 60.3 in July and the Employment Index slipped to 50.7 in August from 51.4 in July. The services sector of the economy is becoming more important as over 80% of Americans are employed in service-oriented businesses. Near the end of the week, the stock and bond markets were hit with selling following the European Central Bank’s (ECB) decision to maintain its zero interest rate policy while leaving its quantitative easing program at its current level. The ECB left its deposit rate unchanged at -0.40%; its main refinance rate unchanged at 0.0%; the marginal lending rate unchanged at 0.25%; and its asset purchase program unchanged at 80 billion euros per month. Traders were disappointed the ECB decided not to extend the program’s asset purchases beyond its March 2017 expiration date. Also weighing heavily on investor sentiment were “hawkish” comments made by Boston Fed President and FOMC voting member Eric Rosengren, who is traditionally seen as a prominent Fed “dove.” Rosengren said a rate hike may be necessary as a preventative measure so certain sectors of the economy won’t overheat. Rosengren noted the labor market continues to "gradually tighten" and "the combination of the relatively strong domestic demand and the restocking of inventories should provide a basis for growth to exceed 2% over the next two quarters." Rosengren also said he would be in favor of gradual interest-rate hikes, saying waiting too long risks some asset markets, like commercial real estate, becoming “too ebullient.” These comments coming from a Fed official normally seen as “dovish” increased the belief that the Fed seems determined on hiking interest rates even if the economic data continues to be inconsistent and not that supportive for a rate hike. The 30-day Fed Funds futures prices are currently predicting the probability for a September 21 rate hike at 24.0%. In housing, the Mortgage Bankers Association (MBA) released their latest Mortgage Application Data for the week ending September 2
nd showing the overall seasonally adjusted Market Composite Index increased 0.9%. The seasonally adjusted Purchase Index rose 1.0% from the prior week, while the Refinance Index also increased 1.0%. Overall, the refinance portion of mortgage activity increased to 64.0% of total applications from 63.5% in the prior week. The adjustable-rate mortgage share of activity fell to 4.3% of total applications from 4.6% in the prior week. According to the MBA, the average contract interest rate for 30-year fixed-rate mortgages with a conforming loan balance increased from 3.67% to 3.68% with points increasing to 0.37 from 0.33. For the week, the FNMA 3.0% coupon bond lost 12.5 basis points to end at $103.50 while the 10-year Treasury yield increased 6.74 basis points to end at 1.6749%. Stocks ended the week lower with the Dow Jones Industrial Average losing 406.51 points to end at 18,085.45. The NASDAQ Composite Index dropped 123.99 points to close at 5,125.91, and the S&P 500 Index lost 52.17 points to close at 2,127.81. Year to date, and exclusive of any dividends, the Dow Jones Industrial Average has gained 3.65%, the NASDAQ Composite Index has added 2.31%, and the S&P 500 Index has advanced 3.94%. This past week, the national average 30-year mortgage rate increased to 3.46% from 3.42% while the 15-year mortgage rate increased to 2.80% from 2.76%. The 5/1 ARM mortgage rate rose to 2.90% from 2.85%. FHA 30-year rates held steady at 3.25% and Jumbo 30-year rates increased to 3.60% from 3.53%.
Mortgage Rate Forecast with Chart For the week, the FNMA 30-year 3.0% coupon bond ($103.50, -12.5 basis points) traded within a wider 63 basis point range between a weekly intraday high of $104.08 on Wednesday and a weekly intraday low of $103.45 on Friday before closing the week at $103.50. A sell signal on Thursday from a three-day Evening Star candlestick pattern forecast market weakness on Friday and turned out to be accurate as the bond continued to decline, falling below a dual level of support provided by the 50-day and 25-day moving averages at $103.74 and $103.72 respectively. These moving averages will now revert to overhead resistance levels. The next level of support is found at the 38.2% Fibonacci retracement level at $103.15. Also, the slow stochastic oscillator now shows a negative crossover sell signal suggesting further market weakness lies ahead. If this signal proves to be reliable we could see a slight worsening in mortgage rates this week.
Chart: FNMA 30-Year 3.0% Coupon Bond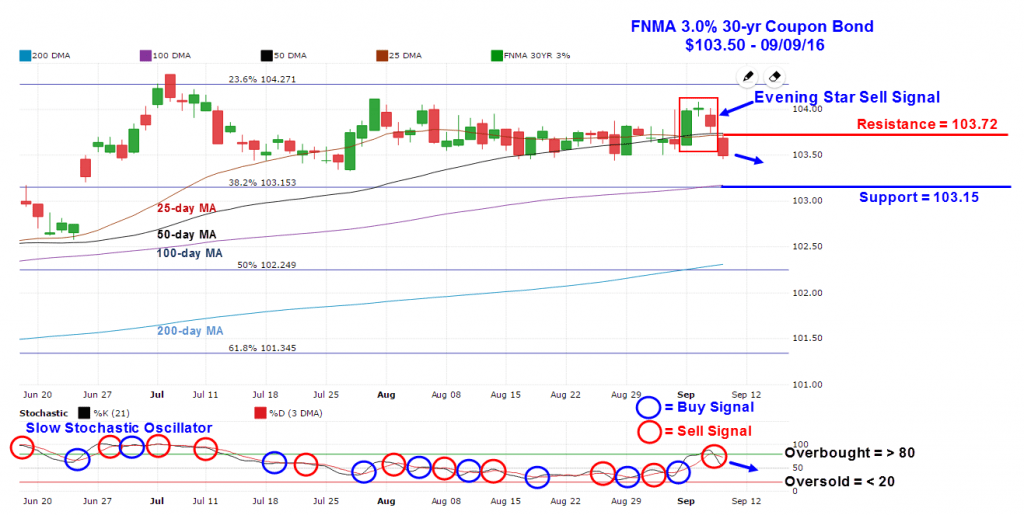 Economic Calendar - for the Week of September 5, 2016
 Economic reports having the greatest potential impact on the financial markets are highlighted in bold.
| Date | TimeET | Event /Report /Statistic | For | Market Expects | Prior |
| Sept 13 | 14:00 | Treasury Budget | Aug | NA | -$64.4B |
| Sept 14 | 07:00 | MBA Mortgage Index | 09/10 | NA | 0.9% |
| Sept 14 | 08:30 | Export Prices excluding agriculture | Aug | NA | 0.3% |
| Sept 14 | 08:30 | Import Prices excluding oil | Aug | NA | 0.3% |
| Sept 14 | 10:30 | Crude Oil Inventories | 09/10 | NA | -14.513M |
| Sept 15 | 08:30 | Initial Jobless Claims | 09/10 | 263,000 | 259,000 |
| Sept 15 | 08:30 | Continuing Jobless Claims | 09/03 | NA | 2,144K |
| Sept 15 | 08:30 | Retail Sales | Aug | -0.1% | 0.0% |
| Sept 15 | 08:30 | Retail Sales excluding automobiles | Aug | 0.3% | -0.3% |
| Sept 15 | 08:30 | Producer Price Index (PPI) | Aug | 0.1% | -0.4% |
| Sept 15 | 08:30 | Core PPI | Aug | 0.1% | -0.3% |
| Sept 15 | 08:30 | Philadelphia Fed Manufacturing Index | Sept | 0.0 | 2.0 |
| Sept 15 | 08:30 | Current Account Balance | 2nd Qtr. | -$122.8B | -$124.7B |
| Sept 15 | 08:30 | New York Empire State Manufacturing Index | Sept | 0.0 | -4.2 |
| Sept 15 | 09:15 | Industrial Production | Aug | -0.3% | 0.7% |
| Sept 15 | 09:15 | Capacity Utilization | Aug | 75.7% | 75.9% |
| Sept 15 | 10:00 | Business Inventories | July | 0.1% | 0.2% |
| Sept 16 | 08:30 | Consumer Price Index (CPI) | Aug | 0.1% | 0.0% |
| Sept 16 | 08:30 | Core CPI | Aug | 0.2% | 0.1% |
| Sept 16 | 10:00 | Univ. of Michigan Consumer Sentiment Index | Sept | 91.5 | 89.8 |
