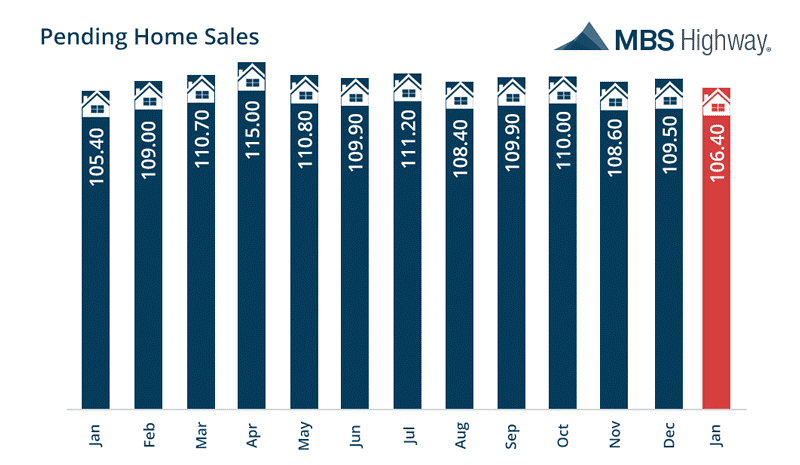
The major stock market indexes continued moving higher to record new all-time highs for the fourth consecutive week as investor sentiment was boosted following President Trump’s highly anticipated and successful first speech before both houses of Congress. Bonds did not fare as well with prices falling and yields rising in response to the week’s positive economic data and President Trump’s speech proposing increased infrastructure spending and greater economic stimulus. In economic news, a robust reading on manufacturing activity improved investor sentiment. The Institute for Supply Management’s Purchasing Managers’ Index recorded its highest level since late 2014 with the New Orders Index reaching its highest level in almost four years. Moreover, weekly Initial Jobless Claims fell to 223,000, the lowest level in 43 years. On Friday, a speech by Fed Chair Janet Yellen made it fairly certain the central bank will raise interest rates at their next meeting on March 15. Yellen stated “we currently judge that it will be appropriate to gradually increase the federal funds rate if the economic data continue to come in about as we expect. Indeed, at our meeting later this month, the Committee will evaluate whether employment and inflation are continuing to evolve in line with our expectations, in which case a further adjustment of the federal funds rate would likely be appropriate.” The two-year Treasury yield spiraled to its highest level in nearly 10 years following Yellen's speech, but it didn’t seem to have much impact on longer-dated Treasury yields as these had already risen earlier in the week. This past week in housing the National Association of Realtors (NAR) reported their Pending Home Sales Index, based on contract signings of previously owned homes, unexpectedly fell 2.8% to 106.4 in January, led by a shortage of housing inventory in the West and Midwest regions. Furthermore, the December Pending Sales Index was revised lower from 1.6% to 0.8% to a value of 109.5. Although this was the lowest reading since January 2016, the Index is now 0.4% higher since then. NAR chief economist Lawrence Yun remarked "The significant shortage of listings last month along with deteriorating affordability as the result of higher home prices and mortgage rates kept many would-be buyers at bay.”
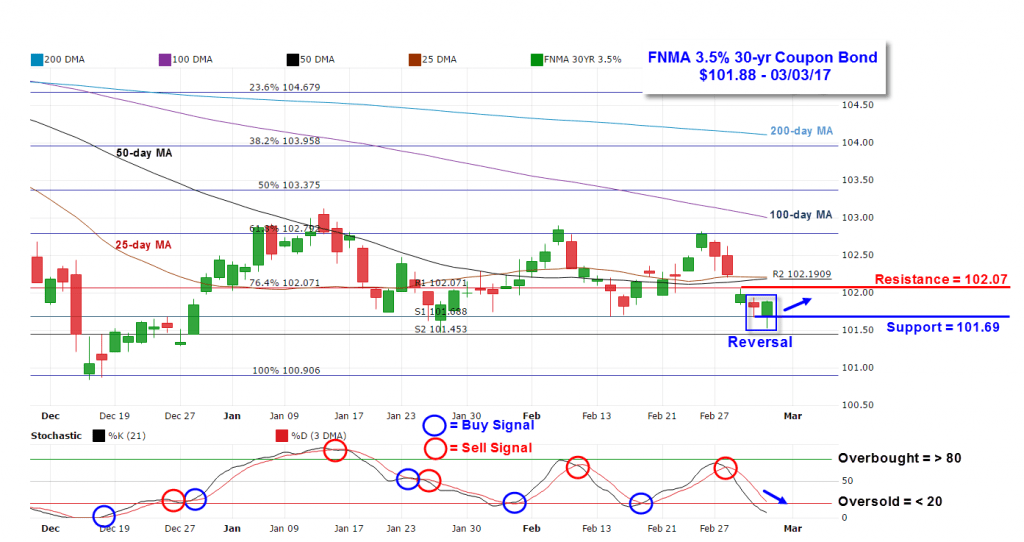
Mortgage Rate Forecast with Chart - FNMA 30-Year 3.5% Coupon Bond The FNMA 30-year 3.5% coupon bond ($101.88, -90.6 bp) traded within a wider 117 basis point range between a weekly intraday high of $102.70 on Monday and a weekly intraday low of $101.53 on Friday before closing the week at $101.88. The chart shows the bond failed to continue higher through overhead resistance, and instead pivoted lower as stocks continued their historic run higher while being extremely overbought technically. The bond fell through several layers of support during the week until bouncing higher off of support found at $101.69 on Friday. In fact, Friday’s action resulted in a small engulfing lines candlestick pattern, a buy signal suggesting higher prices in the short-term. Overhead technical resistance is now found at the 76.4% Fibonacci retracement level at $102.07. The slow stochastic oscillator shows bonds are becoming “oversold” suggesting bond prices could soon continue to move higher. Meanwhile, the stock market remains extremely “overbought” with more pronounced sell signals being generated by numerous momentum indicators. Although the stock market has probably already priced in the next rate hike by the Federal Reserve, as the Fed’s next policy meeting on March 15 approaches, investors may get nervous and begin to sell positions to lock in some of their profits. Should this scenario take place, we may see a slight improvement in mortgage rates as bond prices improve
| Date | TimeET | Event /Report /Statistic | For | Market Expects | Prior |
| Mar 06 | 10:00 | Factory Orders | Jan | 1.0% | 1.3% |
| Mar 07 | 08:30 | Balance of Trade | Jan | -$48.5B | -$44.3B |
| Mar 07 | 15:00 | Consumer Credit | Jan | $17.0B | $14.2B |
| Mar 08 | 07:00 | MBA Mortgage Index | 03/04 | NA | 5.8% |
| Mar 08 | 08:15 | ADP Employment Change | Feb | 180,000 | 246,000 |
| Mar 08 | 08:30 | Revised Productivity | Q4 | 1.5% | 1.3% |
| Mar 08 | 08:30 | Revised Unit Labor Costs | Q4 | 1.6% | 1.7% |
| Mar 08 | 10:00 | Wholesale Inventories | Jan | -0.1% | 1.0% |
| Mar 08 | 10:30 | Crude Oil Inventories | 03/04 | NA | +1.5M |
| Mar 09 | 07:30 | Challenger Job Cuts | Feb | NA | -38.8% |
| Mar 09 | 08:30 | Export Prices excluding agriculture | Feb | NA | 0.1% |
| Mar 09 | 08:30 | Import Prices excluding oil | Feb | NA | -0.2% |
| Mar 09 | 08:30 | Initial Jobless Claims | 03/04 | 240,000 | 223,000 |
| Mar 09 | 08:30 | Continuing Jobless Claims | 2/25 | NA | 2,066K |
| Mar 10 | 08:30 | Nonfarm Payrolls | Feb | 188,000 | 227,000 |
| Mar 10 | 08:30 | Nonfarm Private Payrolls | Feb | 185,000 | 237,000 |
| Mar 10 | 08:30 | Unemployment Rate | Feb | 4.7% | 4.8% |
| Mar 10 | 08:30 | Average Hourly Earnings | Feb | 0.2% | 0.1% |
| Mar 10 | 08:30 | Average Workweek | Feb | 34.4 | 34.4 |
| Mar 10 | 14:00 | Treasury Budget | Feb | NA | -$192.6B |