There were two major news events impacting the financial markets this past week. The first occurred on Tuesday when both the stock and bond markets received a boost following “dovish” comments made by Fed Chair Janet Yellen. Although Yellen talked confidently about the economy with its stronger employment gains and resiliency in consumer spending, she was far less thrilled with the global economy and its possible future negative impact on our economy. Yellen declared "Global developments pose ongoing risks.” Yellen referred to uncertainty over China's economic slowdown and concerns that another plunge in oil prices could lead to further spending cuts by oil producing countries resulting in greater job losses at energy firms. Yellen remarked that responses to a slowing Chinese economy and lower oil prices "could have adverse spillover effects to the rest of the global economy." Traders believed Yellen’s comments made a case for postponing the next rate hike and the stock and bond markets reacted by surging higher. The second event took place on Friday with the arrival of the March Employment Situation Summary, commonly known as the Jobs Report. Both the stock and bond markets went on a bit of a rollercoaster ride with the arrival of a “goldilocks” jobs report. The “mixed,” not too hot or too cold, jobs report from the Labor Department showed Nonfarm Payrolls increasing by 215,000 jobs, slightly ahead of the consensus forecast of 200,000. Nonfarm Private Payrolls matched the consensus estimate of 195,000 while the Unemployment Rate edged higher to 5.0% from 4.9% as more people entered the workforce, but were unable to find jobs. Hourly Earnings increased by +0.3% to match the consensus estimate and were 0.4% higher than February’s reading of -0.1%. In housing, the National Association of Realtors reported their Pending Home Sales Index in February increased 3.5%, the best reading in seven months, to 109.1 from a downwardly revised January reading of 105.4. The consensus estimate had called for a month-over-month increase of 1.1%. On a year-over-year basis, February’s index was 0.7% higher, the smallest monthly gain in the past 18 months.

Elsewhere, the Case-Shiller 20-city Index showed home prices in 20 major metropolitan areas increased 0.8% in January compared with last December, and increased 5.7% year-over-year to match the consensus forecast. Home prices in Portland, Seattle and San Francisco recorded the largest year-over-year gains. As for mortgages, the Mortgage Bankers Association released their latest Mortgage Application Data for the week ending March 25 showing the overall seasonally adjusted Market Composite Index decreased 1.0%. The seasonally adjusted Purchase Index increased 2.0% from the prior reporting period while the Refinance Index decreased 3.0%. Overall, the refinance portion of mortgage activity decreased to 52.4% of total applications from 53.9%. The adjustable-rate mortgage segment of activity was unchanged from 4.9% the previous week. The average contract interest rate for 30-year fixed-rate mortgages with conforming loan balance increased from 3.93% to 3.94%. For the week, the FNMA 3.0% coupon bond gained 95.3 basis points to end at $102.67 while the 10-year Treasury yield fell 12.6 basis points to end at 1.7740%. Stocks ended the week with the Dow Jones Industrial Average gaining 277.02 points to end at 17,792.75. The NASDAQ Composite Index added 141.03 points to close at 4,914.54, and the S&P 500 Index advanced 36.84 points to close at 2,072.78. Year to date, and exclusive of any dividends, the Dow Jones Industrial Average has gained 2.07%, the NASDAQ Composite Index has lost 1.89%, and the S&P 500 Index has grown 1.39%. This past week, the national average 30-year mortgage rate decreased to 3.65% from 3.79% while the 15-year mortgage rate fell to 2.94% from 3.05%. The 5/1 ARM mortgage rate decreased to 2.95% from 2.96%. FHA 30-year rates decreased to 3.25% from 3.35% and Jumbo 30-year rates decreased to 3.52% from 3.63%.
Mortgage Rate Forecast with Chart For the week, the FNMA 30-year 3.0% coupon bond ($102.67, +95.3 bp) traded within a wider 105 basis point range between a weekly intraday low of $101.72 and a weekly intraday high of 102.77 before closing at $101.67 on Friday. This past week began with new buy signals on Monday and Tuesday that carried prices higher for the entire week. The week’s news events reduced the likelihood of an interest rate hike in the near-term resulting in bond prices surging above several layers of technical resistance at the 25-day ($102.00) and 50-day ($102.06) moving averages as well as the 23.6% Fibonacci retracement level at $102.38. These levels now revert to technical support. The next technical resistance level is found at the intraday high on February 24 at $102.92. The current technical picture is unclear. The bond’s sharp upward momentum resulted in the slow stochastic oscillator becoming “overbought” indicating the bond will become more susceptible to a turn lower in price. The oscillator appears to be setting up for a negative crossover sell signal, but it is possible the bond could remain overbought for an extended period of time with prices challenging resistance. Should the bond’s price continue toward resistance this week, mortgage rates will hold steady or improve slightly. However, if a negative crossover sell signal emerges, bond prices could move toward support causing mortgage rates to rise slightly. The economic calendar for this week does not have the market-moving catalysts that last week’s calendar had so the bond market will likely take direction from the way the stock and crude oil markets trade along with the bond market’s own internally generated technical signals.
Chart: FNMA 30-Year 3.0% Coupon Bond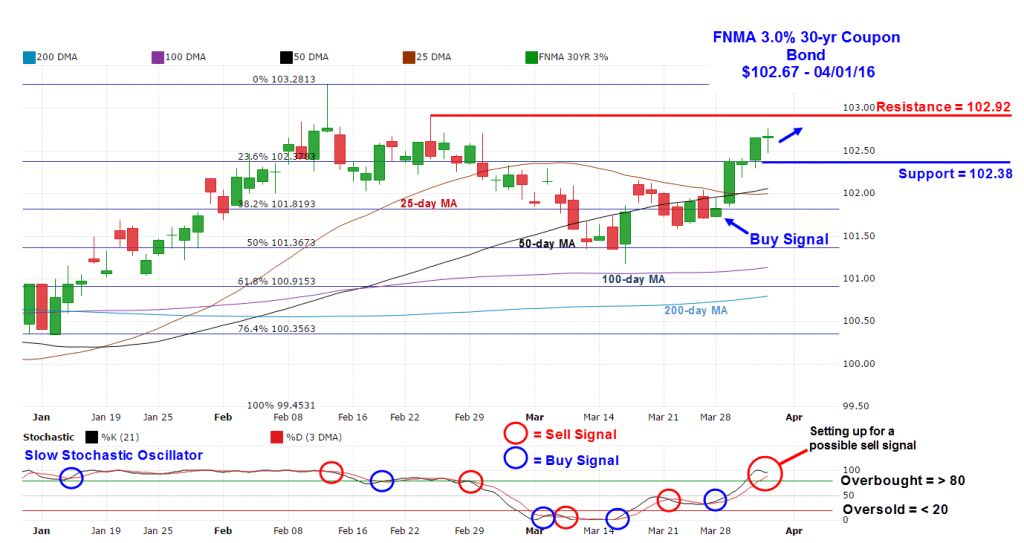 Economic Calendar - for the Week of April 4, 2016
 The economic calendar contracts this week with just a handful of economic reports that will have any effect on the markets. Economic reports having the greatest potential impact on the financial markets are highlighted in bold.
| Date | TimeET | Event /Report /Statistic | For | Market Expects | Prior |
| Apr 04 | 10:00 | Factory Orders | Feb | -1.7% | 1.6% |
| Apr 05 | 08:30 | Balance of Trade | Feb | -$46.20B | -$45.7B |
| Apr 05 | 10:00 | ISM Services Index | Mar | 54.0 | 53.4 |
| Apr 06 | 07:00 | MBA Mortgage Index | 04/02 | NA | -1.0% |
| Apr 06 | 10:30 | Crude Oil Inventories | 04/02 | NA | 2.299M |
| Apr 06 | 14:00 | FOMC Meeting Minutes | Mar 16 | NA | NA |
| Apr 07 | 08:30 | Initial Jobless Claims | 04/02 | 270K | 276K |
| Apr 07 | 08:30 | Continuing Jobless Claims | 03/26 | NA | 2173K |
| Apr 07 | 15:00 | Consumer Credit | Feb | $14.40B | $10.5B |
| Apr 08 | 10:00 | Wholesale Inventories | Feb | -0.2% | 0.3% |
| Upcoming Federal Reserve FOMC Meeting Schedule & Rate Hike Probability ** |
| April 2016 | 26-27, (Tuesday-Wednesday) | 5% Chance |
| June 2016 | 14-15, (Tuesday-Wednesday)* | 26% Chance |
| July 2016 | 26-27, (Tuesday-Wednesday) | 40% Chance |
| September 2016 | 20-21, (Tuesday-Wednesday)* | 51% Chance |
| November 2016 | 1-2, (Tuesday-Wednesday) | 55% Chance |
| December 2016 | 20-21 (Tuesday-Wednesday)* | 66% Chance |
| February 2017 | 01/31-02/01 (Tuesday-Wednesday)* | 68% Chance |
* Meeting associated with a Summary of Economic Projections and a press conference by the Chairman.** Probability generated from the CME Group FedWatch tool based on the 30-day Fed Funds futures prices