The major stock market indexes struggled during the week while the bond market performed well from mid-week on. Corporate earnings and economic reports were mixed throughout the week and contributed to an increase in bond prices and lower yields as investors sought a safer refuge in lower risk assets. In economic news, New Home Sales were reported softer than expected with a 1.5% decline in March from February to 511,000 annualized units while economists had been looking for a slightly higher reading of 521,000. This decline isn’t quite as bad as it seems as February’s originally reported 512,000 in new home sales was revised higher to 519,000. The Western Region led sales lower with a sharp 23.6% decline. This region has experienced explosive housing growth and is prone to volatile swings in housing sales. The median New Home Sales price dropped 1.8% from the year ago period to $288,000. However, the National Association of Realtors reported some encouraging news for the housing sector with Pending Home Sales reaching their highest level in almost a year by rising 1.4% in March over February’s level. The consensus forecast had been for a 0.3% increase. The sales index rose to 110.5, the highest level since May 2015. A reading of 100 is equal to the average level of contract activity during 2001.

As for mortgages, the Mortgage Bankers Association (MBA) released their latest Mortgage Application Data for the week ending April 22
nd showing the overall seasonally adjusted Market Composite Index decreased 4.1%. The seasonally adjusted Purchase Index fell 2.0%, while the Refinance Index decreased 5.0%. Overall, the refinance portion of mortgage activity decreased to 54.4% of total applications from 55.4%. The adjustable-rate mortgage share of activity increased to 5.2% from 5.0% of total applications. According to the MBA, the average contract interest rate for 30-year fixed-rate mortgages with conforming loan balance increased from 3.83% to 3.85% with 0.35 points paid. Elsewhere, Durable Goods Orders for March were uninspiring with an increase of only 0.8% versus a consensus forecast of 1.7% and would have been flat had it not been for higher defense spending. Also, the advance estimate for 1
st quarter Gross Domestic Product (GDP) was reported at a weak 0.5%. Initial Jobless Claims rose by 9,000 for the week but remained among the lowest level on record for total claims, with the four-week average of claims at its lowest level in 42 years. There were a couple of inflation measures reported during the week and both were rather tame. Core PCE Prices, the Fed’s favorite inflation measurement, was reported at a small 0.1% gain month-over-month to match the consensus estimate. Furthermore, the year-over-year number fell to 1.6% from 1.7% in a slightly deflationary move. The Labor Department released another inflation measure, the Employment Cost Index (ECI) for the first quarter of 2016. This broad measure of workers’ wages and benefits grew at a seasonally adjusted rate of 0.6% to match the consensus forecast. On a year-over-year basis, total compensation increased 1.9% during the 1st quarter, slowing from the 2% annual gain recorded during each of the prior three quarters. The bond market did not immediately respond to these tame inflation reports, but did favorably react with increased buying activity following the Fed’s FOMC meeting and policy statement on Wednesday. The Fed left interest rates unchanged in a range between 0.25% and 0.50% as widely anticipated and the accompanying policy statement was nearly a carbon copy of the last one. However, Wednesday’s policy statement removed all references to global economic risks, suggesting these risks are not strong enough to rule out a rate hike in June. The FOMC statement noted "labor market conditions have improved further even as growth in economic activity appears to have slowed." For the week, the FNMA 3.0% coupon bond gained 40.7 basis points to end at $102.44 while the 10-year Treasury yield decreased 5.6 basis points to end at 1.835%. Stocks ended the week with the Dow Jones Industrial Average losing 230.11 points to end at 17,773.64. The NASDAQ Composite Index dropped 130.87 points to close at 4,775.36, and the S&P 500 Index declined 26.28 points to close at 2,065.30. Year to date, and exclusive of any dividends, the Dow Jones Industrial Average has gained 1.96%, the NASDAQ Composite Index has lost 4.86%, and the S&P 500 Index has gained 1.03%. This past week, the national average 30-year mortgage rate fell to 3.67% from 3.75% while the 15-year mortgage rate decreased to 2.95% from 3.02%. The 5/1 ARM mortgage rate rose to 3.04% from 3.00%. FHA 30-year rates fell to 3.25% from 3.35% and Jumbo 30-year rates decreased to 3.62% from 3.66%.
Mortgage Rate Forecast with Chart For the week, the FNMA 30-year 3.0% coupon bond ($102.44, +40.7 bp) traded within a slightly narrower 66 basis point range between a weekly intraday low of $101.89 and a weekly intraday high of 102.55 before closing at $102.45 on Friday. The bond demonstrated greater volatility for the week by declining on Monday and Tuesday before staging a sharp rally on Wednesday through Friday. The rally pushed the bond through multiple layers of resistance provided by the 50-day moving average at $102.25, the 23.6% Fibonacci retracement level at $102.36, and the 25-day moving average at $102.43. The 50-day moving average now reverts to a primary support level. The slow stochastic oscillator is trending higher from a new buy signal generated last Thursday and is far from “overbought,” so if the stock market continues to falter this coming week we could see bond prices improve and move past resistance to provide a slight improvement in mortgage rates. The economic news this coming week, headlined by the April Employment Situation Report on Friday, could be a catalyst for a significant bond market move that is hopefully to the upside resulting in an improvement in mortgage rates.
Chart: FNMA 30-Year 3.0% Coupon Bond 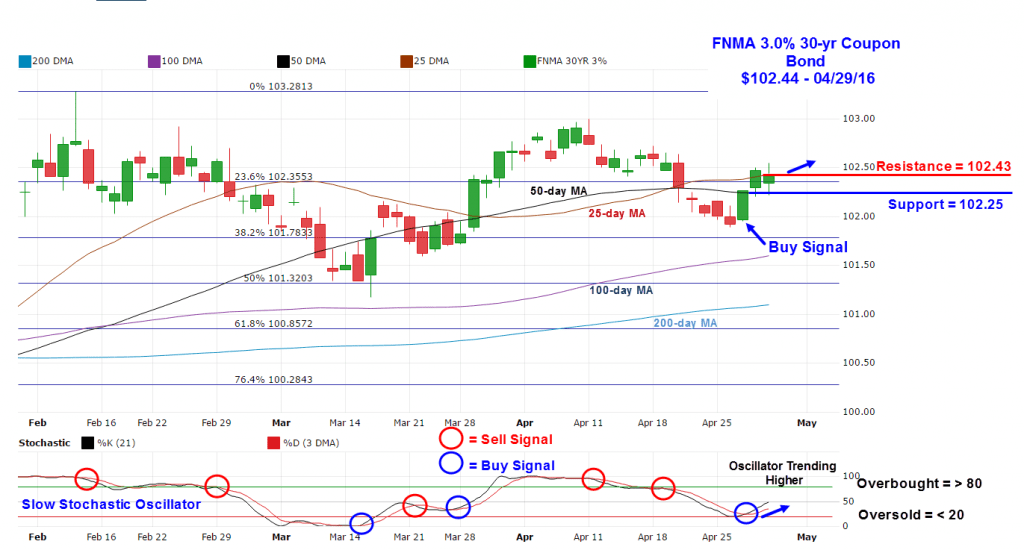
Economic Calendar - for the Week of May 02, 2016 The economic calendar this week features the April Employment Situation Report on Friday. Economic reports having the greatest potential impact on the financial markets are highlighted in bold.
| Date | TimeET | Event /Report /Statistic | For | Market Expects | Prior |
| May 02 | 10:00 | ISM Index | Apr | 51.4 | 51.8 |
| May 02 | 10:00 | Construction Spending | Mar | 0.6% | -0.5% |
| May 04 | 07:00 | MBA Mortgage Index | 04/30 | NA | -4.1% |
| May 04 | 08:15 | ADP Employment Change | Apr | 196,000 | 200,000 |
| May 04 | 08:30 | Preliminary Productivity | Qtr.1 | -1.4% | -2.2% |
| May 04 | 08:30 | Preliminary Unit Labor Costs | Qtr.1 | 2.6% | 3.3% |
| May 04 | 08:30 | Balance of Trade | Mar | -$41.4B | -$47.10B |
| May 04 | 10:00 | Factory Orders | Mar | 0.5% | -1.7% |
| May 04 | 10:00 | ISM Services | Apr | 54.5 | 54.5 |
| May 04 | 10:30 | Crude Oil Inventories | 04/30 | NA | 1.99M |
| May 05 | 07:30 | Challenger Job Cuts | Apr | NA | 31.7% |
| May 05 | 08:30 | Initial Jobless Claims | 04/30 | 259,000 | 257,000 |
| May 05 | 08:30 | Continuing Jobless Claims | 04/23 | NA | 2,130K |
| May 06 | 08:30 | Nonfarm Payrolls | Apr | 207,000 | 215,000 |
| May 06 | 08:30 | Nonfarm Private Payrolls | Apr | 191,000 | 195,000 |
| May 06 | 08:30 | Unemployment Rate | Apr | 5.0% | 5.0% |
| May 06 | 08:30 | Hourly Earnings | Apr | 0.3% | 0.3% |
| May 06 | 08:30 | Average Workweek | Apr | 34.5 | 34.4 |
| May 06 | 15:00 | Consumer Credit | Mar | $18.0B | $17.3B |
| Upcoming Federal Reserve FOMC Meeting Schedule & Rate Hike Probability ** |
| June 2016 | 14-15, (Tuesday-Wednesday)* | 11% Chance |
| July 2016 | 26-27, (Tuesday-Wednesday) | 28% Chance |
| September 2016 | 20-21, (Tuesday-Wednesday)* | 41% Chance |
| November 2016 | 1-2, (Tuesday-Wednesday) | 44% Chance |
| December 2016 | 20-21 (Tuesday-Wednesday)* | 60% Chance |
| February 2017 | 01/31-02/01 (Tuesday-Wednesday)* | 62% Chance |
* Meeting associated with a Summary of Economic Projections and a press conference by the Chairman.** Probability generated from the CME Group FedWatch tool based on the 30-day Fed Funds futures prices.