This past week there were numerous economic reports released to influence stock and bond traders highlighted by a somewhat disappointing November employment report. Other influential reports included the second estimate of 3
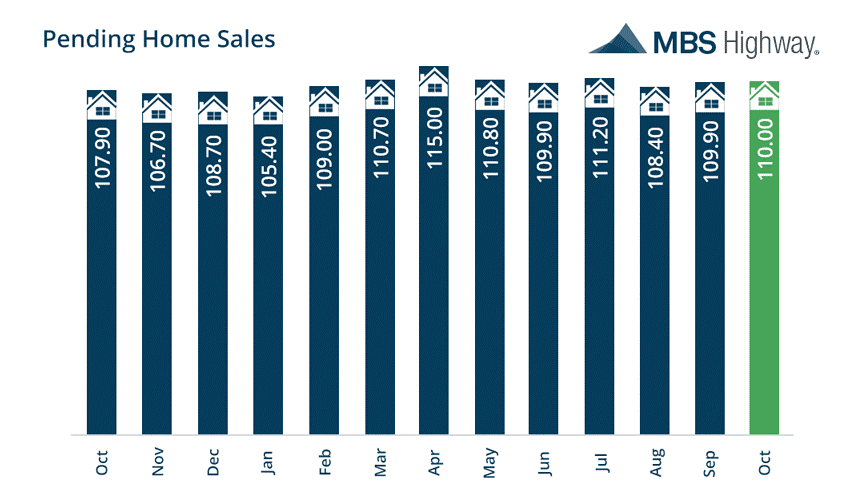
rd Quarter GDP; the October Personal Income and Spending report; and the Institute for Supply Management’s (ISM) Manufacturing Index for November. These latter reports generally exceeded consensus forecasts to lend support for a Federal Reserve interest rate hike of 25 basis points at the Fed’s next FOMC meeting on December 14. The current probability for a rate hike at this meeting based on the CME Group 30-Day Fed Fund futures prices is 97.2%. The Labor Department’s November jobs report showed Nonfarm Payrolls missed the consensus forecast of 180,000 with a reading of 178,000. Also, October’s initially reported 161,000 new jobs were downwardly revised to 142,000. Nonfarm Private Payrolls came in at 156,000 to miss the consensus estimate of 170,000, and October’s number was downwardly revised to 135,000 from 142,000. Average Hourly Earnings disappointed with a decline of 0.1% month-over-month to miss the consensus forecast calling for +0.2% growth. The Unemployment Rate fell more than expected to 4.6% from 4.9%, but this was due to 450,000 people falling out of the labor force and not from the month-over-month gain of 160,000 additionally employed people. The November labor force participation rate dropped slightly to 62.7% but remains near 40-year lows. The number of people not in the labor force increased to 95.05 million, up from 94.6 million in October 2016, and 94.4 million in November 2015. In housing, the S&P/Case-Shiller national home price index climbed to a record high of 184.80 in September to exceed the previous high of 184.62 set in July 2006 – the peak of the housing boom. The 20-city Home Price Index increased by 5.1% year-over-year while the national index increased 5.5% year-over-year. Further, the National Association of Realtors reported home buyers showed more caution in October as Pending Home Sales increased just 0.1% month-over-month when the consensus forecast had called for a 0.7% increase. On a year-over-year basis, Pending Home Sales are 1.8% higher.
Elsewhere, the Mortgage Bankers Association (MBA) released their latest Mortgage Application Data for the week ending November 25 showing the overall seasonally adjusted Market Composite Index fell 9.4%. The seasonally adjusted Purchase Index fell 0.2% from the prior week, while the Refinance Index decreased 16.0%. Overall, the refinance portion of mortgage activity fell to 55.1% of total applications from 58.2%. The adjustable-rate mortgage share of activity accounted for 5.7% of total applications. According to the MBA, the average contract interest rate for 30-year fixed-rate mortgages with a conforming loan balance increased from 4.16% to 4.23% with points increasing to 0.41 from 0.39. For the week, the FNMA 3.5% coupon bond gained 14.0 basis points to end at $ 102.61 while the 10-year Treasury yield increased 3.32 basis points to end at 2.39%. Stocks ended the week “mixed” with the Dow Jones Industrial Average gaining 18.28 points to end at 19,170.42. The NASDAQ Composite Index fell 143.27 points to close at 5,255.65, and the S&P 500 Index lost 21.40 points to close at 2,191.95. Year to date, and exclusive of any dividends, the Dow Jones Industrial Average has gained 9.10%, the NASDAQ Composite Index has added 4.72%, and the S&P 500 Index has advanced 6.75%. This past week, the national average 30-year mortgage rate decreased to 4.13% from 4.19% while the 15-year mortgage rate decreased to 3.34% from 3.39%. The 5/1 ARM mortgage rate fell to 3.03% from 3.06%. FHA 30-year rates increased to 3.85% from 3.80% and Jumbo 30-year rates decreased to 4.20% from 4.25%.
Economic Calendar - for the Week of December 5, 2016 Economic reports having the greatest potential impact on the financial markets are highlighted in bold.
| Date | TimeET | Event /Report /Statistic | For | Market Expects | Prior |
| Dec 05 | 10:00 | ISM Services Index | Nov | 55.6 | 54.8 |
| Dec 06 | 08:30 | Revised 3rd Quarter Productivity | Qtr. 3 | 3.3% | 3.1% |
| Dec 06 | 08:30 | Revised 3rd Unit Labor Costs | Qtr. 3 | 0.2% | 0.3% |
| Dec 06 | 08:30 | Balance of Trade | Oct | -$41.8B | -$36.4B |
| Dec 06 | 10:00 | Factory Orders | Oct | 2.5% | 0.3% |
| Dec 07 | 07:00 | MBA Mortgage Index | 12/03 | NA | -9.4% |
| Dec 07 | 10:00 | JOLTS - Job Openings | Oct | NA | 5.486M |
| Dec 07 | 10:30 | Crude Oil Inventories | 12/03 | NA | -0.884M |
| Dec 07 | 15:00 | Consumer Credit | Oct | $18.7B | $19.3B |
| Dec 08 | 08:30 | Initial Jobless Claims | 12/03 | 255K | 268K |
| Dec 08 | 08:30 | Continuing Jobless Claims | 11/26 | NA | 2081K |
| Dec 08 | 10:30 | Natural Gas Inventories | 12/03 | NA | NA |
| Dec 09 | 10:00 | Univ. of Michigan Consumer Sentiment Index | Dec | 94.3 | 93.8 |
| Dec 09 | 10:00 | Wholesale Inventories | Oct | -0.4% | 0.1% |
Mortgage Rate Forecast with ChartFNMA 30-Year 3.5% Coupon Bond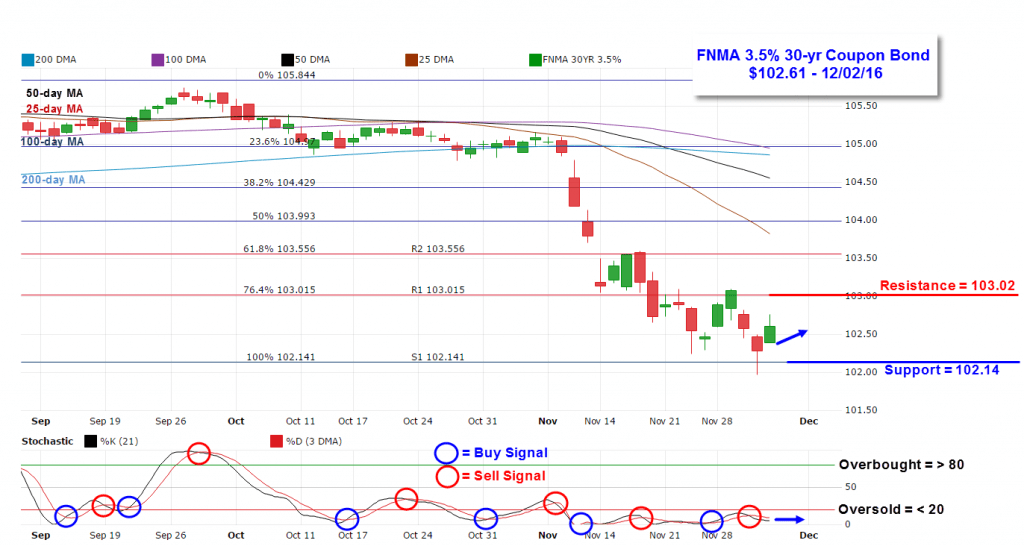
It was a fairly volatile week for bond prices characterized by choppy, up and down trading. The FNMA 30-year 3.5% coupon bond ($102.61, +14.0 basis points) traded within a wide 112 basis point range between a weekly intraday high of $103.09 on Tuesday and a weekly intraday low of $101.97 on Thursday before closing the week at $102.61. Thursday’s “Hammer” candlestick signaled a possible reversal on Friday, and the bond did bounce higher to move about mid-way within a wide trading range between the 100% Fibonacci retracement support level ($102.14) and the 76.4% Fibonacci retracement resistance level. If the stock market loses some of its luster this coming week, we should see bond prices rise toward resistance resulting in a slight improvement in mortgage rates
