
Stock market traders responded with a “relief rally” to the previous Friday’s air strike on Syria when they realized it was limited in scope and after it did not trigger a military response from Russia. Additionally, crude oil prices continued to rally with West Texas Intermediate crude moving closer to $70 per barrel, a price level not seen since November 2014. The higher oil prices combined with stronger than forecast retail sales and housing data released during the week sparked inflation fears resulting in lower bond prices and higher yields. Friday, the 10-year Treasury note traded with a 2.96% yield, the highest yield since January 8, 2014. Retail Sales increased 0.6% in March versus a consensus forecast of +0.4%, ending a streak of three consecutive monthly declines. Housing Starts and Building Permits for the month of March were also strong with Housing Starts reported at a seasonally adjusted annualized rate of 1.319 million, compared to expectations for 1.267 million. Building Permits reached a rate of 1.354 million, 33,000 greater than forecasts. However, while the headline data was strong in both reports, the underlying trend wasn't quite as positive as single-family units actually declined on a month-over-month basis with a drop of 3.7% in Starts and a decline of over 5% in Permits. However, multi-family unit starts and permits were both higher by double-digit percentages. From the mortgage industry, the latest data from the Mortgage Bankers Association’s (MBA) weekly mortgage applications survey showed a rise in mortgage applications. The MBA reported their overall seasonally adjusted Market Composite Index (application volume) increased 4.9% during the week ended April 13, 2018. The seasonally adjusted Purchase Index increased 6.0% from the week prior while the Refinance Index increased by 4.0%. Overall, the refinance portion of mortgage activity fell to 37.6% from 38.4% of total applications from the prior week, its lowest level since September 2008. The adjustable-rate mortgage share of activity increased to 6.6% from 6.3% of total applications. According to the MBA, the average contract interest rate for 30-year fixed-rate mortgages with a conforming loan balance remained unchanged at 4.66% with points remaining at 0.46. For the week, the FNMA 4.0% coupon bond fell 57.8 basis points to close at $101.688 while the 10-year Treasury yield increased 13.54 basis points to end at 2.9602%. The major stock indexes managed to move modestly higher during the week. The Dow Jones Industrial Average gained 102.80 points to close at 24,462.94. The NASDAQ Composite Index advanced 39.48 points to close at 7,146.13. The S&P 500 Index added 13.84 points to close at 2,670.14. Year to date on a total return basis, the Dow Jones Industrial Average has fallen 1.04%, the NASDAQ Composite Index has gained 3.52%, and the S&P 500 Index has lost 0.13%. This past week, the national average 30-year mortgage rate increased to 4.58% from 4.50%; the 15-year mortgage rate rose to 3.95% from 3.89%; the 5/1 ARM mortgage rate increased to 3.77% from 3.68% while the FHA 30-year rate moved from 4.25% to 4.37%. Jumbo 30-year rates rose to 4.59% from 4.51%. Economic Calendar - for the Week of April 23, 2018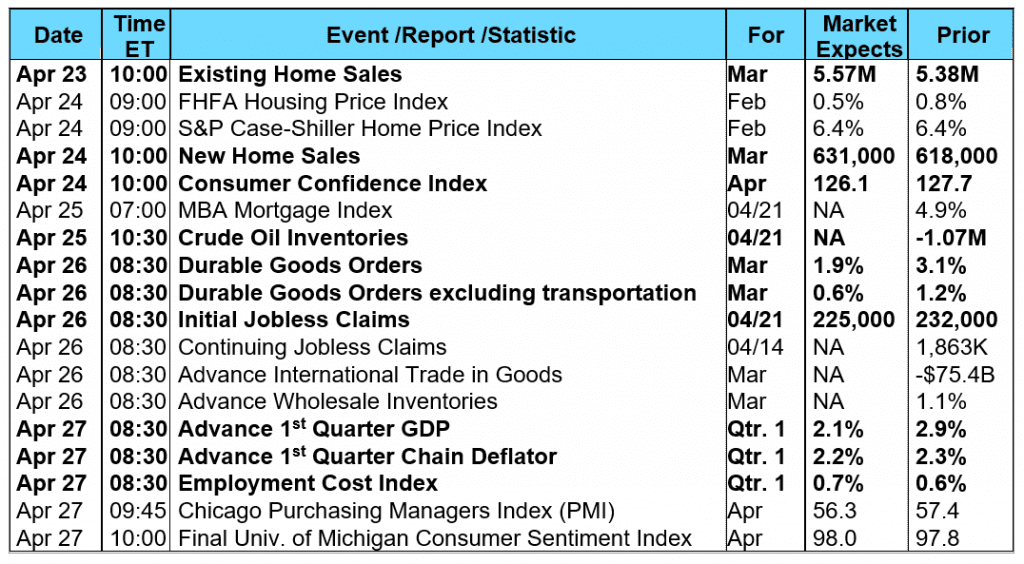 Economic reports having the greatest potential impact on the financial markets are highlighted in bold. Mortgage Rate Forecast with Chart - FNMA 30-Year 4.0% Coupon Bond The FNMA 30-year 4.0% coupon bond ($101.688, -57.8 bp) traded within a narrower 55.6 basis point range between a weekly intraday high of $102.328 on Tuesday and a weekly intraday low of $101.672 on Friday before closing the week at $101.688 on Friday. Mortgage bond prices continued to retreat during the week on renewed inflation fears and a resilient stock market with investors preparing for what many believe will be a strong 1 st Quarter earnings season that is just getting underway. Although mortgage bond prices moved slightly higher on Monday and Tuesday, they declined the remainder of the week, falling below the $102 support level. The $102 level now becomes a resistance level with additional resistance found at the 25-day and 50-day moving averages at $102.3588. Support is found at $101.563, a low from September 5, 2013. The bond now finds itself significantly “oversold,” but there are no evident signs of a reversal at the present time. The chart is “bearish” and we could see a continuing decline for a test of support at $101.563. Should this happen, we would see a slight deterioration in mortgage rates this coming week.
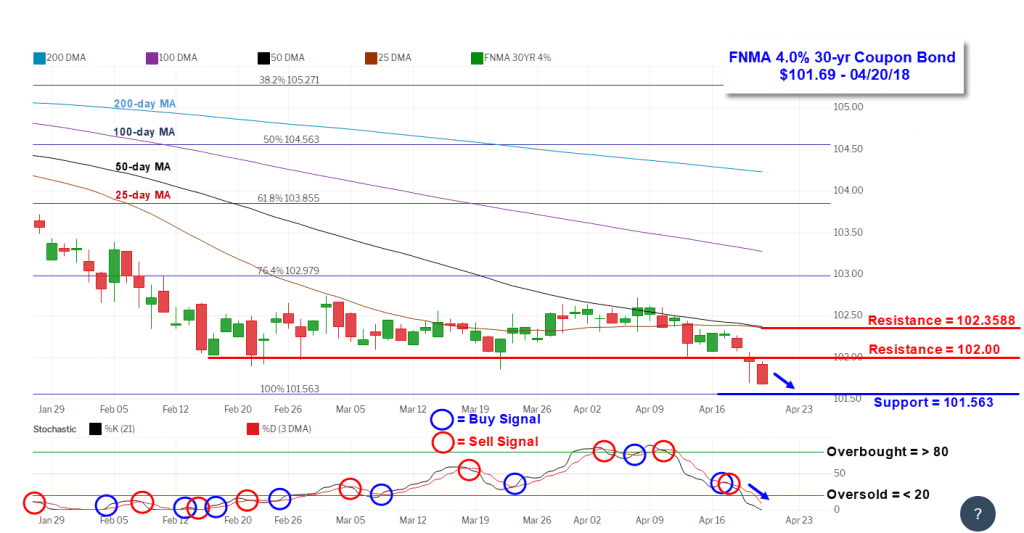
Economic reports having the greatest potential impact on the financial markets are highlighted in bold. Mortgage Rate Forecast with Chart - FNMA 30-Year 4.0% Coupon Bond The FNMA 30-year 4.0% coupon bond ($101.688, -57.8 bp) traded within a narrower 55.6 basis point range between a weekly intraday high of $102.328 on Tuesday and a weekly intraday low of $101.672 on Friday before closing the week at $101.688 on Friday. Mortgage bond prices continued to retreat during the week on renewed inflation fears and a resilient stock market with investors preparing for what many believe will be a strong 1 st Quarter earnings season that is just getting underway. Although mortgage bond prices moved slightly higher on Monday and Tuesday, they declined the remainder of the week, falling below the $102 support level. The $102 level now becomes a resistance level with additional resistance found at the 25-day and 50-day moving averages at $102.3588. Support is found at $101.563, a low from September 5, 2013. The bond now finds itself significantly “oversold,” but there are no evident signs of a reversal at the present time. The chart is “bearish” and we could see a continuing decline for a test of support at $101.563. Should this happen, we would see a slight deterioration in mortgage rates this coming week.