
The major stock market indexes made a solid advance during the week amid strong jobs and economic data resulting in lower bond prices and rising yields. Tuesday, the ISM Non-manufacturing Index showed a greater than forecast expansion in the services sector with a reading of 58.6 in May from 56.8 in April. This increase matched the rise in the ISM Manufacturing Index for May, suggesting second quarter GDP growth will show a noticeable increase over GDP growth in the first quarter. Also on Tuesday, the monthly Job Openings and Labor Turnover Survey (JOLTS) showed there were 6.698 million job openings available in April with only 6.4 million available workers to fill them. This is the second month in a row where there were more job vacancies than available hires, a phenomenon the American economy has never experienced before until March and April of this year. Although this situation should create a demand for higher wages, average hourly earnings only increased 2.7% annualized in May, up one-tenth of a point from April. However, you can bet the Fed will be keeping a close eye on wage growth going forward, and there is no doubt that they will raise interest rates for the second time this year when they announce their rate-hike decision this Wednesday. There was one housing related report released this past week. Tuesday, CoreLogic reported their latest Home Price Index (HPI) and Forecast for April 2018 showing home prices increased by 1.2% month-over-month in April and by 6.9% year-over-year from April 2017. CoreLogic is forecasting their national HPI will continue to increase 5.3% on a year-over-year basis from April 2018 to April 2019 and will rise another 0.2% for May 2018. Frank Nothaft, CoreLogic Chief Economist, remarked “The best antidote for rising home prices is additional supply. New construction has failed to keep up with and meet new housing growth or replace existing inventory. More construction of for-sale and rental housing will alleviate housing cost pressures.” Analyzing home values in the country’s 100 largest metropolitan areas based on housing inventory indicated 40% of metropolitan areas had an overvalued housing market, 28% were undervalued, and 32% were considered at value as of April 2018. When evaluating only the top 50 markets, 52% were overvalued, 14% were undervalued and 34% were at-value. 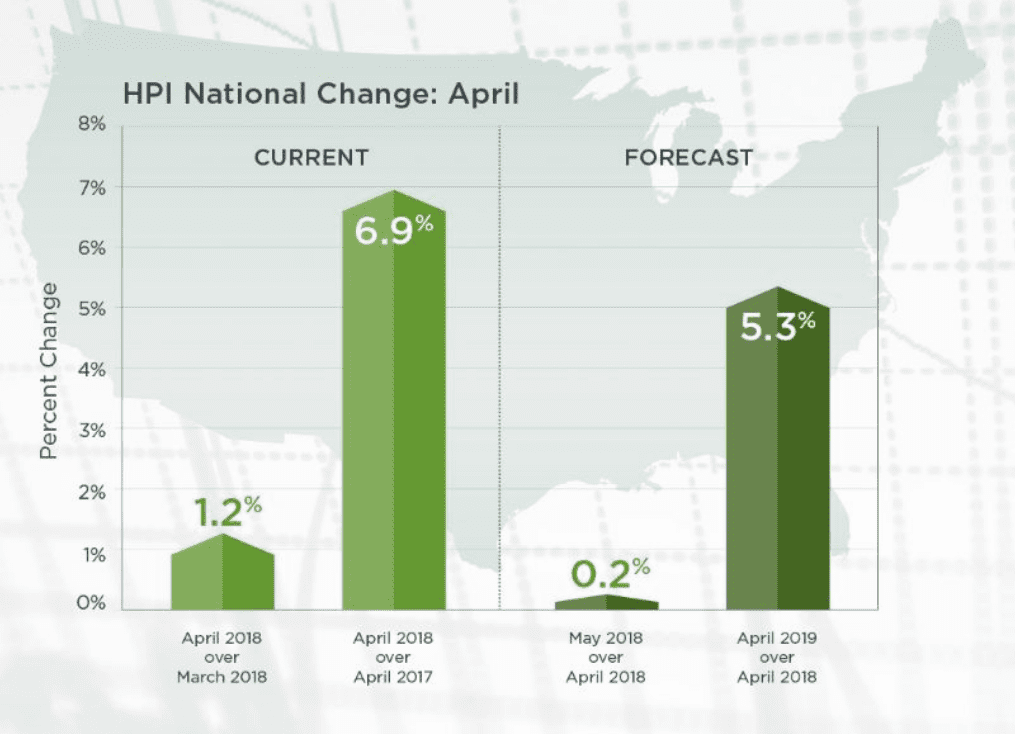 From the mortgage industry, the latest data from the Mortgage Bankers Association’s (MBA) weekly mortgage applications survey showed an increase in mortgage applications. The MBA reported their overall seasonally adjusted Market Composite Index (application volume) increased 4.1% during the week ended June 1, 2018. The seasonally adjusted Purchase Index rose 4.0% from the week prior while the Refinance Index also increased by 4.0% from a week earlier. Overall, the refinance portion of mortgage activity increased to 35.6% from 35.3% of total applications from the prior week. The adjustable-rate mortgage share of activity increased to 7.1% from 6.7% of total applications. According to the MBA, the average contract interest rate for 30-year fixed-rate mortgages with a conforming loan balance decreased to 4.75% from 4.84% with points decreasing to 0.46 from 0.47. For the week, the FNMA 4.0% coupon bond lost 34.4 basis points to close at $101.594 while the 10-year Treasury yield increased 4.8 basis points to end at 2.950%. The three major stock indexes advanced during the week. The Dow Jones Industrial Average gained 681.32 points to close at 25,316.53. The NASDAQ Composite Index added 91.18 points to close at 7,645.51. The S&P 500 Index added 44.41 points to close at 2,779.03. Year to date on a total return basis, the Dow Jones Industrial Average has gained 2.42%, the NASDAQ Composite Index has added 10.75%, and the S&P 500 Index has advanced 3.94%. This past week, the national average 30-year mortgage rate increased to 4.68% from 4.60%; the 15-year mortgage rate rose to 4.11% from 4.04%; the 5/1 ARM mortgage rate increased to 3.94% from 3.93% while the FHA 30-year rate climbed to 4.42% from 4.38%. Jumbo 30-year rates increased to 4.70% from 4.66%. Economic Calendar - for the Week of June 11, 2018 Economic reports having the greatest potential impact on the financial markets are highlighted in bold.
 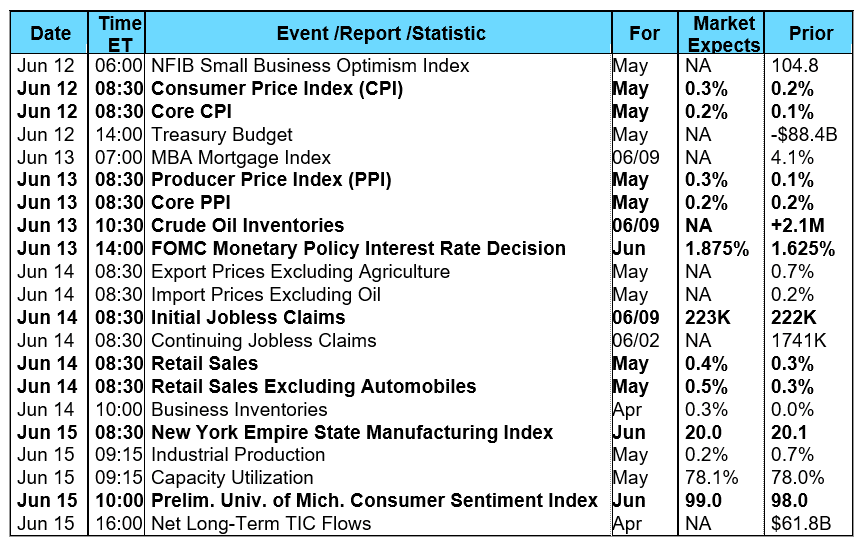 Mortgage Rate Forecast with Chart - FNMA 30-Year 4.0% Coupon Bond The FNMA 30-year 4.0% coupon bond ($101.594, -34.4 bp) traded within a narrower 42.2 basis point range between a weekly intraday high of 101.938 on Monday and a weekly intraday low of $101.516 on Thursday before closing the week at $101.594 on Friday. The bond fell from its position sitting on the 50-day moving average (MA) and continued to slide lower during the week to end just below the 25-day MA. Technically, the last sell signal from May 31 is still in effect and since the bond is still not “oversold,” there is some continuing risk for further mortgage bond price erosion this week. A continuing price move toward the next support level will result in a slight increase in mortgage rates in the coming week.
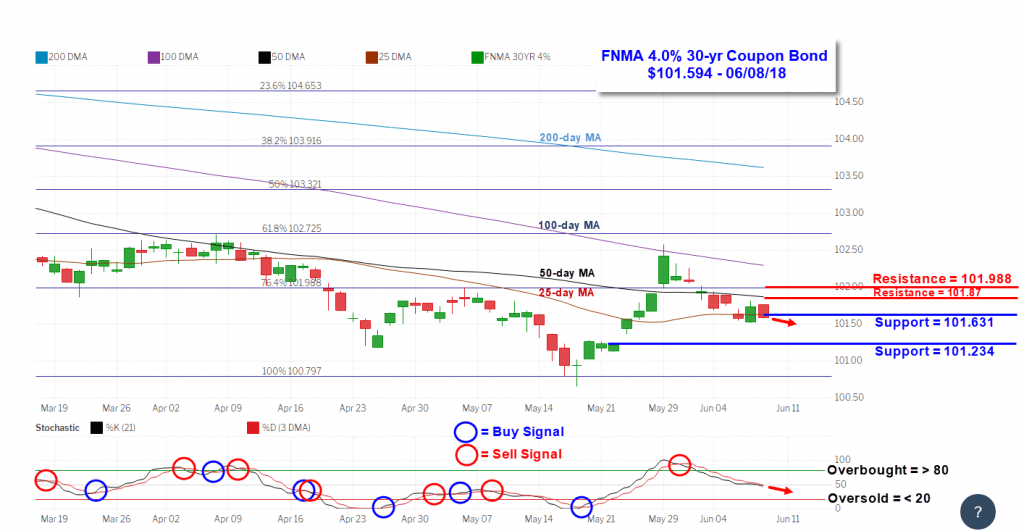
From the mortgage industry, the latest data from the Mortgage Bankers Association’s (MBA) weekly mortgage applications survey showed an increase in mortgage applications. The MBA reported their overall seasonally adjusted Market Composite Index (application volume) increased 4.1% during the week ended June 1, 2018. The seasonally adjusted Purchase Index rose 4.0% from the week prior while the Refinance Index also increased by 4.0% from a week earlier. Overall, the refinance portion of mortgage activity increased to 35.6% from 35.3% of total applications from the prior week. The adjustable-rate mortgage share of activity increased to 7.1% from 6.7% of total applications. According to the MBA, the average contract interest rate for 30-year fixed-rate mortgages with a conforming loan balance decreased to 4.75% from 4.84% with points decreasing to 0.46 from 0.47. For the week, the FNMA 4.0% coupon bond lost 34.4 basis points to close at $101.594 while the 10-year Treasury yield increased 4.8 basis points to end at 2.950%. The three major stock indexes advanced during the week. The Dow Jones Industrial Average gained 681.32 points to close at 25,316.53. The NASDAQ Composite Index added 91.18 points to close at 7,645.51. The S&P 500 Index added 44.41 points to close at 2,779.03. Year to date on a total return basis, the Dow Jones Industrial Average has gained 2.42%, the NASDAQ Composite Index has added 10.75%, and the S&P 500 Index has advanced 3.94%. This past week, the national average 30-year mortgage rate increased to 4.68% from 4.60%; the 15-year mortgage rate rose to 4.11% from 4.04%; the 5/1 ARM mortgage rate increased to 3.94% from 3.93% while the FHA 30-year rate climbed to 4.42% from 4.38%. Jumbo 30-year rates increased to 4.70% from 4.66%. Economic Calendar - for the Week of June 11, 2018 Economic reports having the greatest potential impact on the financial markets are highlighted in bold. Mortgage Rate Forecast with Chart - FNMA 30-Year 4.0% Coupon Bond The FNMA 30-year 4.0% coupon bond ($101.594, -34.4 bp) traded within a narrower 42.2 basis point range between a weekly intraday high of 101.938 on Monday and a weekly intraday low of $101.516 on Thursday before closing the week at $101.594 on Friday. The bond fell from its position sitting on the 50-day moving average (MA) and continued to slide lower during the week to end just below the 25-day MA. Technically, the last sell signal from May 31 is still in effect and since the bond is still not “oversold,” there is some continuing risk for further mortgage bond price erosion this week. A continuing price move toward the next support level will result in a slight increase in mortgage rates in the coming week.