
Although the Nasdaq Composite Index set a new all-time high last Wednesday, the three major stock indexes finished the week lower amid escalating trade tensions primarily between the U.S. and China and the U.S. and the European Union. The Trump Administration wants to level the playing field when it comes to trade and tariffs by negotiating better deals to protect American workers and the economy. U.S. tariffs are among the lowest in the world and in our nation’s history. U.S. trade policy has long favored lower tariffs and fewer restrictions on the movement of goods and services across international borders while our trading partners have been more restrictive. The U.S. is currently running the following trade deficits: China - $636 billion traded with a $375 billion deficit. Mexico - $557 billion traded with a $71 billion deficit. Japan - $204 billion traded with a $69 billion deficit. Germany - $171 billion traded with a $65 billion deficit. Canada - $582 billion traded with an $18 billion deficit. In response to all of the tariff and trade war talk, longer-term bond yields slipped marginally lower resulting in relatively stable mortgage rates. 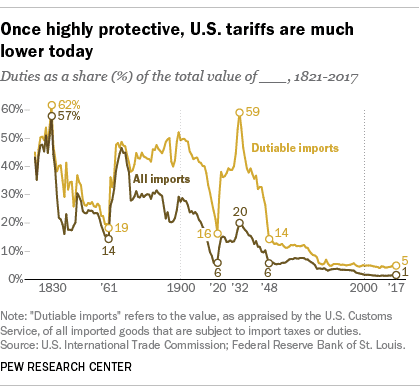 There were several housing-related reports released this past week. Last Monday, the National Association of Home Builders/Wells Fargo Housing Market Index (NAHB) measuring home builder sentiment was reported to have slipped two points to 68 in June. A reading above 50 is considered to indicate positive sentiment. Yet, June’s decline was attributed to soaring lumber prices that have added almost $9,000 to the average price of a new single-family home since January 2017. Robert Dietz, NAHB chief economist, commented “Improved economic growth, continued job creation and solid housing demand should spur additional single-family construction in the months ahead. However, builders do need access to lumber and other construction materials at reasonable costs in order to provide homes at competitive price points, particularly for the entry-level market where inventory is most needed.”
 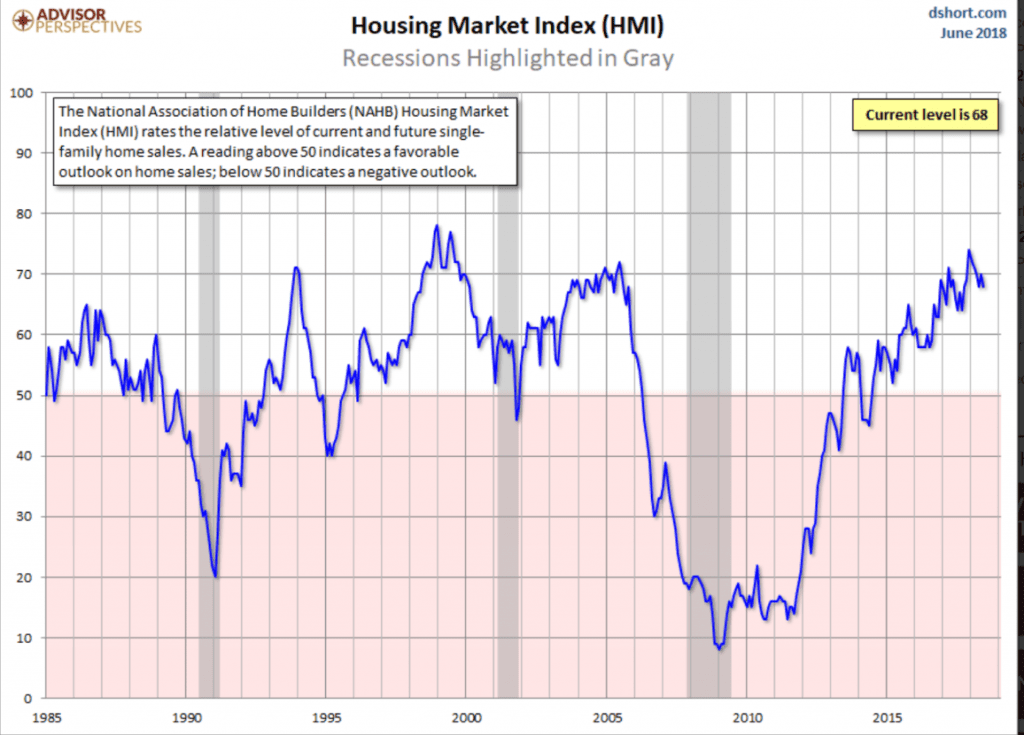 Tuesday, the U.S. Census Bureau and the Department of Housing and Urban Development reported Housing Starts increased 5.0% month-over-month in May to a seasonally adjusted annual rate of 1.350 million, exceeding the consensus forecast of 1.323 million. However, Building Permits declined 4.6% to 1.301 million falling below the consensus estimate of 1.343 million. Permits are a leading indicator of housing market strength and were lower in May for both single-family units (-2.2%) and multi-unit dwellings (-8.8%). This suggests we may see some weakness in the June Housing Starts report. Wednesday, the National Association of Realtors reported sales of Existing Homes declined 0.4% month-over-month in May to a seasonally adjusted annual rate of 5.43 million. This was slightly below the consensus forecast of 5.55 million. The median existing home price for all housing types jumped 4.9% to an all-time high of $264,800 – the 75th straight month of year-over-year gains. Existing home inventory for sale at the end of May rose 2.8% to 1.85 million, but this is 6.1% lower than the same period a year ago. Unsold inventory is currently at a 4.1-month supply at the current sales rate compared to a usual 6.0-month supply associated with a more balanced market. The song remains the same…limited home inventory coupled with rising prices and mortgage rates is hampering affordability, especially for first-time home buyers. Wednesday, the latest data from the Mortgage Bankers Association’s (MBA) weekly mortgage applications survey showed an increase in mortgage applications. The MBA reported their overall seasonally adjusted Market Composite Index (application volume) rose 5.1% during the week ended June 15, 2018. The seasonally adjusted Purchase Index increased 4.0% from the week prior while the Refinance Index increased by 6.0% from a week earlier. Overall, the refinance portion of mortgage activity increased to 36.8% from 35.6% of total applications from the prior week. The adjustable-rate mortgage share of activity increased to 7.0% from 6.8% of total applications. According to the MBA, the average contract interest rate for 30-year fixed-rate mortgages with a conforming loan balance remained unchanged at 4.83% with points decreasing to 0.48 from 0.53. For the week, the FNMA 4.0% coupon bond gained 9.3 basis points to close at $101.734 while the 10-year Treasury yield decreased 2.36 basis points to end at 2.9004%. The Dow Jones Industrial Average lost 509.59 points to close at 24,580.89. The NASDAQ Composite Index fell 53.56 points to close at 7,692.82. The S&P 500 Index dropped 24.78 points to close at 2,754.88. Year to date on a total return basis, the Dow Jones Industrial Average has lost 0.56%, the NASDAQ Composite Index has gained 11.44%, and the S&P 500 Index has advanced 3.04%. This past week, the national average 30-year mortgage rate increased to 4.70% from 4.65%; the 15-year mortgage rate rose to 4.15% from 4.11%; the 5/1 ARM mortgage rate increased to 3.99% from 3.95% while the FHA 30-year rate rose to 4.42% from 4.38%. Jumbo 30-year rates increased to 4.73% from 4.68%. Economic Calendar - for the Week of June 25, 2018 Economic reports having the greatest potential impact on the financial markets are highlighted in bold.
 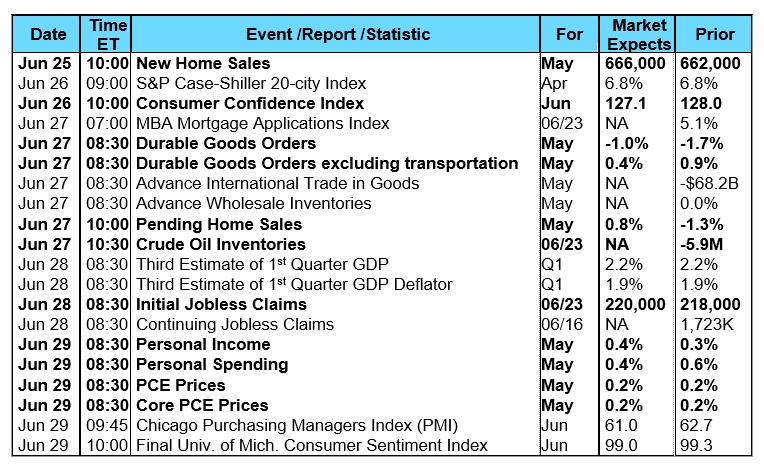 Mortgage Rate Forecast with Chart - FNMA 30-Year 4.0% Coupon Bond The FNMA 30-year 4.0% coupon bond ($101.734, +9.3 bp) traded within a far narrower 28.1 basis point range between a weekly intraday high of 101.859 on Tuesday and a weekly intraday low of $101.578 on Thursday before closing the week at $101.734 on Friday. The bond traded along a convergence between the 25-day and 50-day moving averages (MAs). These MAs act as both short-term support and resistance. Should the 25-day MA cross above the 50-day MA, it would signal market strength and a buy signal likely resulting in a slight improvement in mortgage rates. However, technical resistance is also found at the 76.4% Fibonacci retracement level at $101.988 so any upward move will have to contend with this layer of resistance plus that from the 100-day MA at $102.087. These levels may temper any upward move resulting in stable rates.
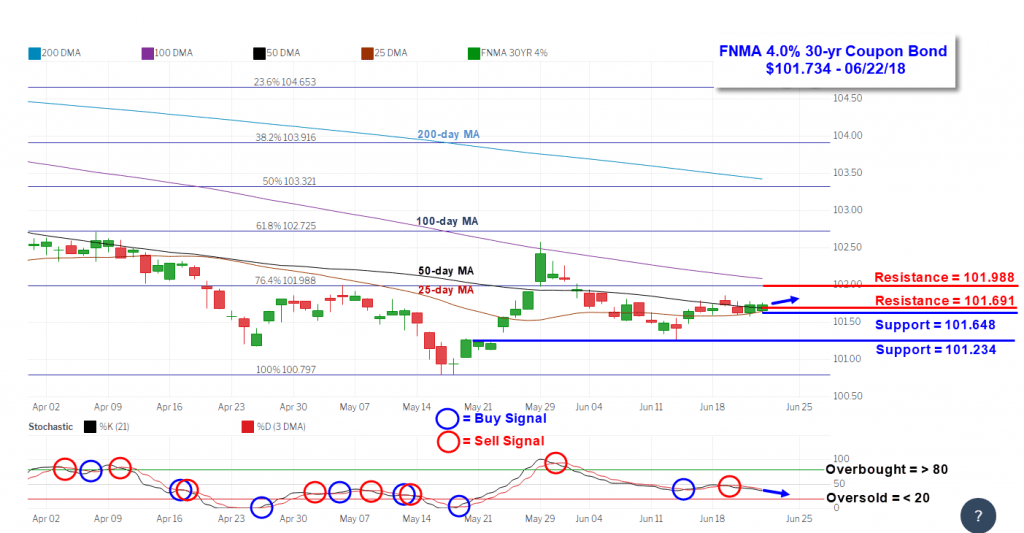
There were several housing-related reports released this past week. Last Monday, the National Association of Home Builders/Wells Fargo Housing Market Index (NAHB) measuring home builder sentiment was reported to have slipped two points to 68 in June. A reading above 50 is considered to indicate positive sentiment. Yet, June’s decline was attributed to soaring lumber prices that have added almost $9,000 to the average price of a new single-family home since January 2017. Robert Dietz, NAHB chief economist, commented “Improved economic growth, continued job creation and solid housing demand should spur additional single-family construction in the months ahead. However, builders do need access to lumber and other construction materials at reasonable costs in order to provide homes at competitive price points, particularly for the entry-level market where inventory is most needed.” Tuesday, the U.S. Census Bureau and the Department of Housing and Urban Development reported Housing Starts increased 5.0% month-over-month in May to a seasonally adjusted annual rate of 1.350 million, exceeding the consensus forecast of 1.323 million. However, Building Permits declined 4.6% to 1.301 million falling below the consensus estimate of 1.343 million. Permits are a leading indicator of housing market strength and were lower in May for both single-family units (-2.2%) and multi-unit dwellings (-8.8%). This suggests we may see some weakness in the June Housing Starts report. Wednesday, the National Association of Realtors reported sales of Existing Homes declined 0.4% month-over-month in May to a seasonally adjusted annual rate of 5.43 million. This was slightly below the consensus forecast of 5.55 million. The median existing home price for all housing types jumped 4.9% to an all-time high of $264,800 – the 75th straight month of year-over-year gains. Existing home inventory for sale at the end of May rose 2.8% to 1.85 million, but this is 6.1% lower than the same period a year ago. Unsold inventory is currently at a 4.1-month supply at the current sales rate compared to a usual 6.0-month supply associated with a more balanced market. The song remains the same…limited home inventory coupled with rising prices and mortgage rates is hampering affordability, especially for first-time home buyers. Wednesday, the latest data from the Mortgage Bankers Association’s (MBA) weekly mortgage applications survey showed an increase in mortgage applications. The MBA reported their overall seasonally adjusted Market Composite Index (application volume) rose 5.1% during the week ended June 15, 2018. The seasonally adjusted Purchase Index increased 4.0% from the week prior while the Refinance Index increased by 6.0% from a week earlier. Overall, the refinance portion of mortgage activity increased to 36.8% from 35.6% of total applications from the prior week. The adjustable-rate mortgage share of activity increased to 7.0% from 6.8% of total applications. According to the MBA, the average contract interest rate for 30-year fixed-rate mortgages with a conforming loan balance remained unchanged at 4.83% with points decreasing to 0.48 from 0.53. For the week, the FNMA 4.0% coupon bond gained 9.3 basis points to close at $101.734 while the 10-year Treasury yield decreased 2.36 basis points to end at 2.9004%. The Dow Jones Industrial Average lost 509.59 points to close at 24,580.89. The NASDAQ Composite Index fell 53.56 points to close at 7,692.82. The S&P 500 Index dropped 24.78 points to close at 2,754.88. Year to date on a total return basis, the Dow Jones Industrial Average has lost 0.56%, the NASDAQ Composite Index has gained 11.44%, and the S&P 500 Index has advanced 3.04%. This past week, the national average 30-year mortgage rate increased to 4.70% from 4.65%; the 15-year mortgage rate rose to 4.15% from 4.11%; the 5/1 ARM mortgage rate increased to 3.99% from 3.95% while the FHA 30-year rate rose to 4.42% from 4.38%. Jumbo 30-year rates increased to 4.73% from 4.68%. Economic Calendar - for the Week of June 25, 2018 Economic reports having the greatest potential impact on the financial markets are highlighted in bold. Mortgage Rate Forecast with Chart - FNMA 30-Year 4.0% Coupon Bond The FNMA 30-year 4.0% coupon bond ($101.734, +9.3 bp) traded within a far narrower 28.1 basis point range between a weekly intraday high of 101.859 on Tuesday and a weekly intraday low of $101.578 on Thursday before closing the week at $101.734 on Friday. The bond traded along a convergence between the 25-day and 50-day moving averages (MAs). These MAs act as both short-term support and resistance. Should the 25-day MA cross above the 50-day MA, it would signal market strength and a buy signal likely resulting in a slight improvement in mortgage rates. However, technical resistance is also found at the 76.4% Fibonacci retracement level at $101.988 so any upward move will have to contend with this layer of resistance plus that from the 100-day MA at $102.087. These levels may temper any upward move resulting in stable rates.