
This past week the stock market ended “mixed” with the Dow Jones Industrial Average and S&P 500 indexes recording marginal gains while the NASDAQ Composite Index slipped modestly lower. Investors were wary of continued rhetorical threats between President Trump and North Korean dictator Kim Jong-un who boasted North Korea would test a hydrogen bomb somewhere over the Pacific Ocean. However, the strong words traded between the U.S. and North Korea took a back seat to the week’s most significant piece of economic news that arrived on Wednesday with the Federal Reserve’s September Federal Open Market Committee (FOMC) Policy Statement. As widely expected, the Fed held the fed funds interest rate at the current range of 1.00-1.25%, but hinted they would raise rates by 25 basis points (0.25%) at their December meeting while looking to raise rates three more times in 2018. U.S. Treasuries and mortgage bond prices ended Wednesday on a sour note, falling in response to the September FOMC Statement. Also in response, the fed funds futures market is now showing the implied probability of a rate hike in December has increased to 72.8% from 57.8% the previous week. More importantly, the FOMC announced it will initiate the balance sheet normalization program beginning in October. This program will allow the Fed to begin reducing its massive $4.5 trillion balance sheet, of which $1.8 trillion is held in mortgage backed securities, by not reinvesting in some of its Treasury and mortgage bonds as they mature. This “rolling off” of its bond holdings will begin with monthly reductions of $4 billion in mortgage securities and $6 billion in Treasuries with these levels rising every quarter until reaching $20 billion in mortgage securities and $30 billion in Treasuries per month. So, how long will it take the Fed to reduce its $1.8 trillion in mortgage securities? Current projections show it will take about seven years. 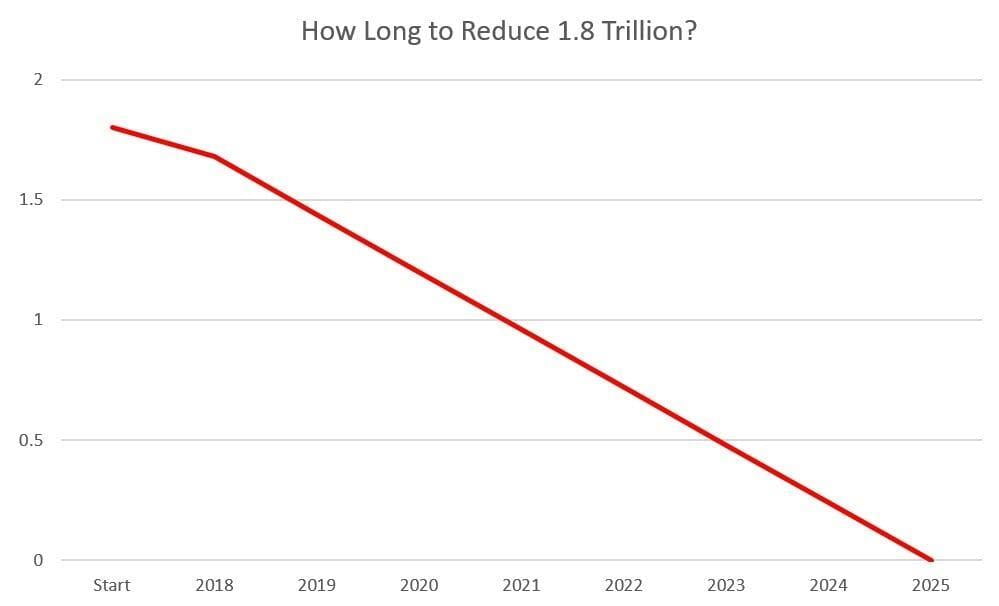 Fed Chair Janet Yellen said the Fed has no plans to tinker with this pace of balance sheet normalization, but would be willing to restart re-investments if the economic outlook deteriorates. In housing, the National Association of Realtors reported Existing Home Sales fell 1.7% in August to a 5.350 million unit annualized pace; coming in lower than analyst expectations of 5.42 million. Inventory levels declined 2.1% to 1.88 million homes for sale while the median existing home price dropped to $253,500. Hurricanes Harvey and Irma interrupted closings in the South to negatively impact the sales count nationwide, and will likely continue to do so in coming months. At the current sales pace, it would take 4.2 months to sell the current home inventory in the market. First-time buyers made up 31% of all sales, a one-year low, compared with 33% in July. Homes typically sold in 30 days, compared with 36 days in August 2016 and 51% of homes sold in August were on market for less than a month.
 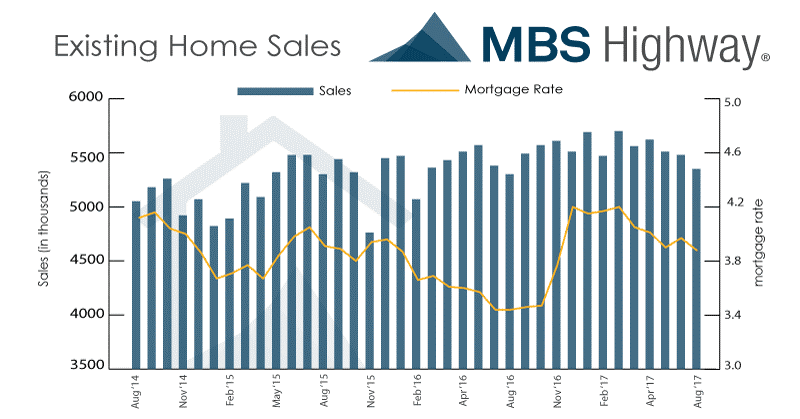 The U.S. Census Bureau reported Housing Starts fell slightly by 0.8% in August from July to a seasonally adjusted annual rate of 1.180 million, driven by continued steep declines in multifamily building. Although buildings with two or more units fell 6.5%, single-family starts increased by 851,000 or by 1.6% in August over July’s revised total of 838,000. The report indicates single-family construction is gradually improving while multifamily construction is declining significantly due to an oversupply of apartments in many urban markets. Meanwhile, Building Permits soared 5.7% to a seasonally adjusted annual rate of 1.300 million from an upwardly revised 1.230 million for July. Ironically, the strength in permits was due to a 19.6% increase in multi-family permits while single-family permits fell by 1.5%
 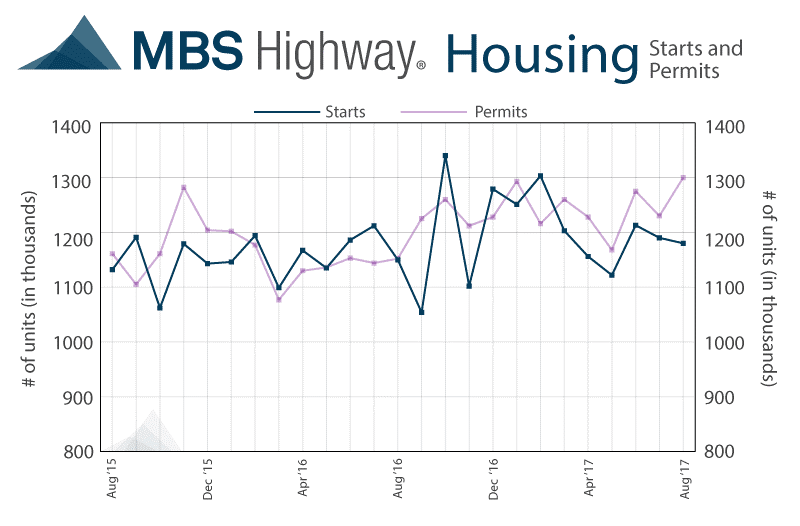 . Mortgage application volume increased during the week ending September 15. The Mortgage Bankers Association (MBA) reported their overall seasonally adjusted Market Composite Index (application volume) fell 9.7%. The seasonally adjusted Purchase Index decreased 11.0% from the prior week while the Refinance Index fell 9.0%. Overall, the refinance portion of mortgage activity increased to 52.1% of total applications from 51.0% in the prior week. The adjustable-rate mortgage share of activity increased to 6.8% of total applications from 6.7%. According to the MBA, the average contract interest rate for 30-year fixed-rate mortgages with a conforming loan balance increased to 4.04% from 4.03% with points remaining unchanged at 0.40. For the week, the FNMA 3.5% coupon bond lost 4.7 basis points to close at $103.234. The 10-year Treasury yield increased 5.11 basis points to end at 2.2534%. The major stock indexes ended the week “mixed”. The Dow Jones Industrial Average gained 81.25 points to close at 22,349.59. The NASDAQ Composite Index fell 21.55 points to close at 6,426.92 and the S&P 500 Index gained 1.99 points to close at 2,502.22. Year to date on a total return basis, the Dow Jones Industrial Average has gained 13.09%, the NASDAQ Composite Index has advanced 19.39%, and the S&P 500 Index has added 11.76%. This past week, the national average 30-year mortgage rate increased to 3.97% from 3.94%; the 15-year mortgage rate increased to 3.27% from 3.22%; the 5/1 ARM mortgage rate remained unchanged at 3.20% and the FHA 30-year rate rose to 3.60% from 3.50%. Jumbo 30-year rates increased to 4.20% from 4.19%. Economic Calendar - for the Week of September 25, 2017 Economic reports having the greatest potential impact on the financial markets are highlighted in bold.
 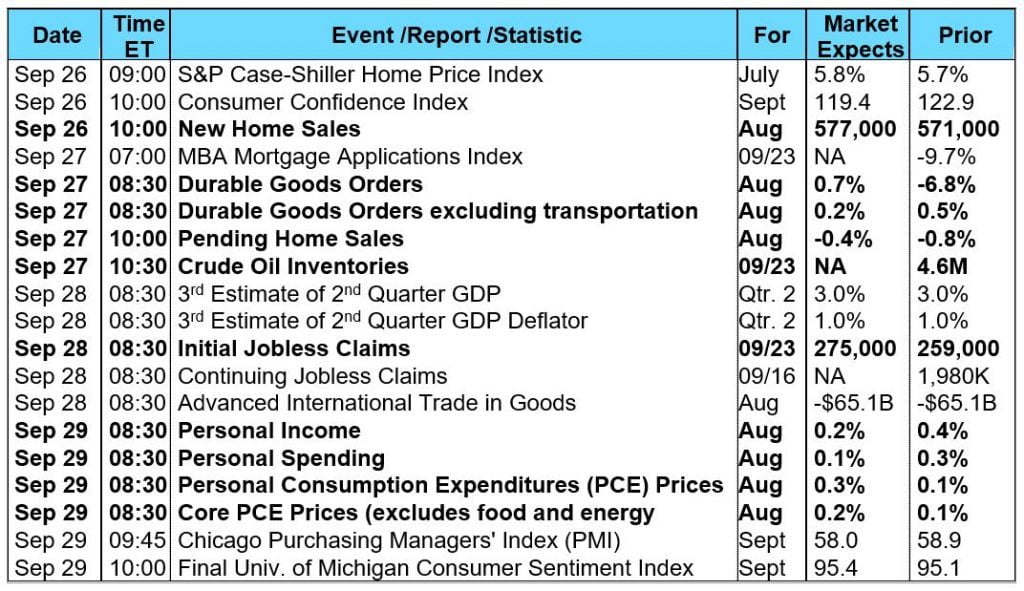 Mortgage Rate Forecast with Chart - FNMA 30-Year 3.5% Coupon Bond The FNMA 30-year 3.5% coupon bond ($103.23, -4.7 bp) traded within a 28.1 basis point range between a weekly intraday low of $103.00 on Wednesday and a weekly intraday high of $103.281 on Tuesday and Wednesday before closing the week at $103.234 on Friday. Mortgage bonds continued lower during the week to test support levels at the 50-day ($103.21) and 100-day ($103.05) moving averages. Friday, the bond bounced higher off of the 100-day moving average support level resulting in a slow stochastic crossover buy signal while being deeply “oversold.” This suggests the bond could continue higher toward the 25-day moving average resistance level in the coming week to send mortgage rates slightly lower.
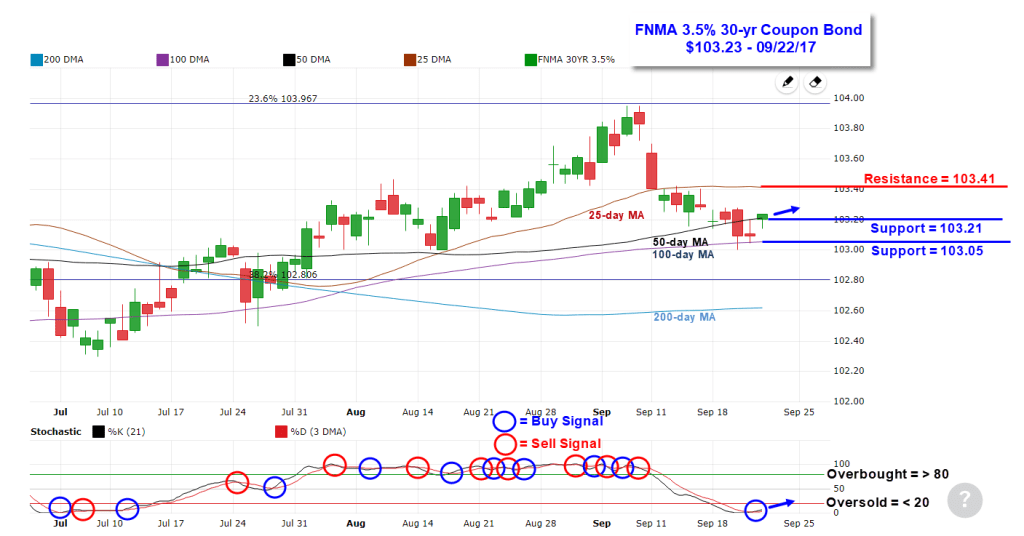
Fed Chair Janet Yellen said the Fed has no plans to tinker with this pace of balance sheet normalization, but would be willing to restart re-investments if the economic outlook deteriorates. In housing, the National Association of Realtors reported Existing Home Sales fell 1.7% in August to a 5.350 million unit annualized pace; coming in lower than analyst expectations of 5.42 million. Inventory levels declined 2.1% to 1.88 million homes for sale while the median existing home price dropped to $253,500. Hurricanes Harvey and Irma interrupted closings in the South to negatively impact the sales count nationwide, and will likely continue to do so in coming months. At the current sales pace, it would take 4.2 months to sell the current home inventory in the market. First-time buyers made up 31% of all sales, a one-year low, compared with 33% in July. Homes typically sold in 30 days, compared with 36 days in August 2016 and 51% of homes sold in August were on market for less than a month. The U.S. Census Bureau reported Housing Starts fell slightly by 0.8% in August from July to a seasonally adjusted annual rate of 1.180 million, driven by continued steep declines in multifamily building. Although buildings with two or more units fell 6.5%, single-family starts increased by 851,000 or by 1.6% in August over July’s revised total of 838,000. The report indicates single-family construction is gradually improving while multifamily construction is declining significantly due to an oversupply of apartments in many urban markets. Meanwhile, Building Permits soared 5.7% to a seasonally adjusted annual rate of 1.300 million from an upwardly revised 1.230 million for July. Ironically, the strength in permits was due to a 19.6% increase in multi-family permits while single-family permits fell by 1.5% . Mortgage application volume increased during the week ending September 15. The Mortgage Bankers Association (MBA) reported their overall seasonally adjusted Market Composite Index (application volume) fell 9.7%. The seasonally adjusted Purchase Index decreased 11.0% from the prior week while the Refinance Index fell 9.0%. Overall, the refinance portion of mortgage activity increased to 52.1% of total applications from 51.0% in the prior week. The adjustable-rate mortgage share of activity increased to 6.8% of total applications from 6.7%. According to the MBA, the average contract interest rate for 30-year fixed-rate mortgages with a conforming loan balance increased to 4.04% from 4.03% with points remaining unchanged at 0.40. For the week, the FNMA 3.5% coupon bond lost 4.7 basis points to close at $103.234. The 10-year Treasury yield increased 5.11 basis points to end at 2.2534%. The major stock indexes ended the week “mixed”. The Dow Jones Industrial Average gained 81.25 points to close at 22,349.59. The NASDAQ Composite Index fell 21.55 points to close at 6,426.92 and the S&P 500 Index gained 1.99 points to close at 2,502.22. Year to date on a total return basis, the Dow Jones Industrial Average has gained 13.09%, the NASDAQ Composite Index has advanced 19.39%, and the S&P 500 Index has added 11.76%. This past week, the national average 30-year mortgage rate increased to 3.97% from 3.94%; the 15-year mortgage rate increased to 3.27% from 3.22%; the 5/1 ARM mortgage rate remained unchanged at 3.20% and the FHA 30-year rate rose to 3.60% from 3.50%. Jumbo 30-year rates increased to 4.20% from 4.19%. Economic Calendar - for the Week of September 25, 2017 Economic reports having the greatest potential impact on the financial markets are highlighted in bold. Mortgage Rate Forecast with Chart - FNMA 30-Year 3.5% Coupon Bond The FNMA 30-year 3.5% coupon bond ($103.23, -4.7 bp) traded within a 28.1 basis point range between a weekly intraday low of $103.00 on Wednesday and a weekly intraday high of $103.281 on Tuesday and Wednesday before closing the week at $103.234 on Friday. Mortgage bonds continued lower during the week to test support levels at the 50-day ($103.21) and 100-day ($103.05) moving averages. Friday, the bond bounced higher off of the 100-day moving average support level resulting in a slow stochastic crossover buy signal while being deeply “oversold.” This suggests the bond could continue higher toward the 25-day moving average resistance level in the coming week to send mortgage rates slightly lower.