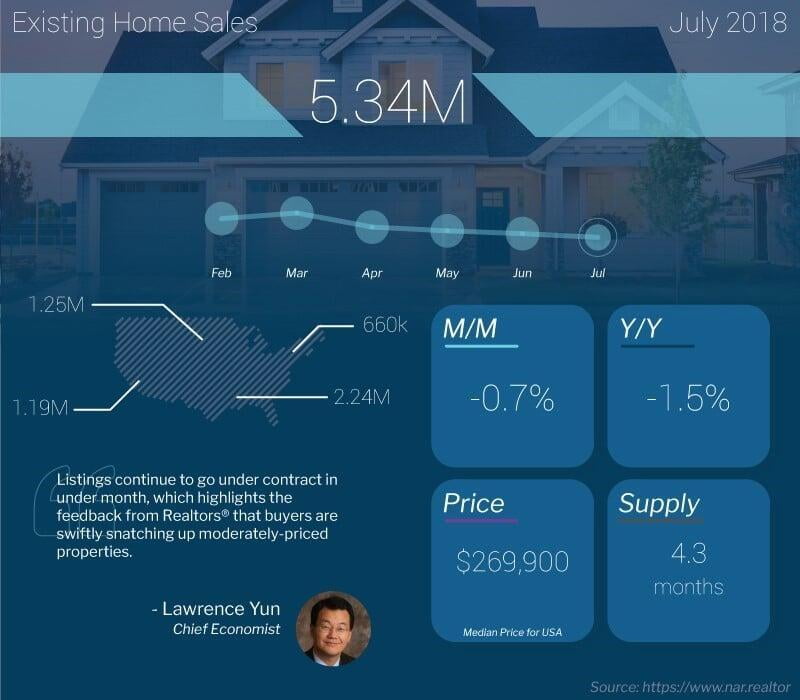
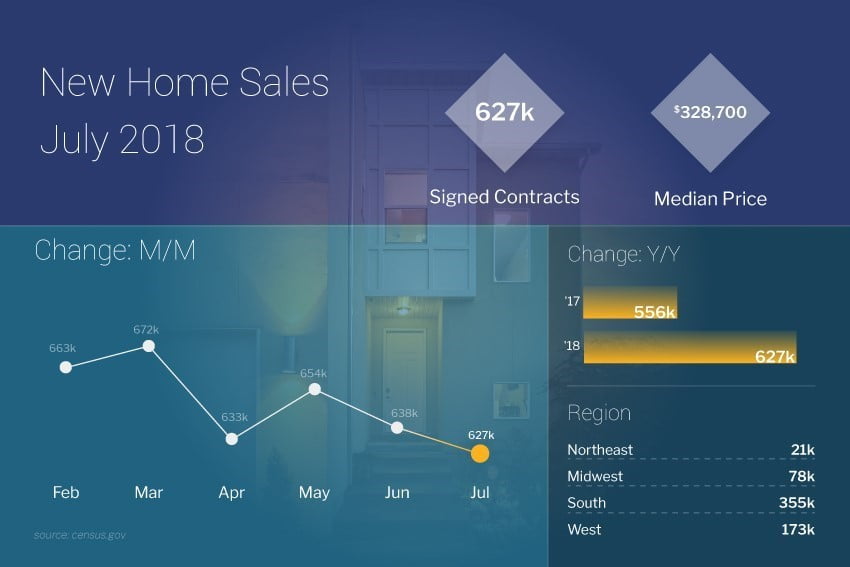
The stock market recorded moderate gains with the S&P 500 notching another all-time record high on Friday, the first time since January 26 th of this year. Bonds also fared well with U.S. Treasury yields decreasing modestly during the week. President Trump’s publicly pronounced unhappiness with Federal Reserve Chair Jerome Powell for raising interest rates in addition to voicing his desire for Fed policymakers to keep interest rates low may have helped boost buying demand for Treasuries, sending yields lower. Because U.S. Treasury yields are substantially higher than many other industrialized nations, U.S. Treasuries remain attractive investments for foreign buyers. President Trump also publicly blamed both the European Union and China of manipulating their currencies to weaken them relative to the U.S. dollar in an effort to boost their exports to the U.S. Although low-level trade talks between the U.S. and China took place in Washington, D.C. during the week, no real progress was made on tariffs and trade. In fact, last Thursday the U.S. began to enforce an additional 25% in tariffs on Chinese imports ranging from machinery to motorcycles while China retaliated with corresponding tariffs on U.S. products from coal to trucks. Trade resolutions may not be realized until later in the year when higher-level negotiations are scheduled to take place. Meanwhile, the minutes from the Fed’s July 31–August 1 monetary policy meeting indicated the Fed expects to next raise rates at its September meeting. Fed officials stated in the minutes that it would likely "soon” be appropriate to raise rates. There currently is a 96.0% probability rates will be bumped up another 25 basis points on September 26. Friday, in a speech at the Kansas City Fed’s annual economic symposium in Jackson Hole, Wyoming, Fed Chair Powell defended the gradual pace of the Fed’s rate hikes saying that the “slow increases are appropriate given current levels of inflation and unemployment.” It was a big week for housing news. Wednesday, the National Association of Realtors reported Existing Home Sales tumbled for the fourth straight month falling to a seasonally-adjusted annual rate of 5.34 million in July, down 0.7% from June. Affordability issues are taking a toll on home buyers, especially for first timers facing ever-increasing prices on lower inventory and seeing home prices increasing faster than their incomes. Total home sales in July were 1.5% lower than the same period a year ago. The median existing home prices for all housing types increased 4.5% in July to $269,600 – the 77th straight month of year-over-year gains. For sales of existing single-family homes, the median price has climbed 4.6% from a year ago to $272,300. Unsold inventory remained at a 4.3-month supply, unchanged from June and last July and remaining below the 6.0-month supply typically associated with a more balanced market. Thursday, the Commerce Department reported sales of New Homes fell 1.7% month-over-month in July to a seasonally adjusted annual rate of 627,000. This was below the consensus forecast of 645,000 and also below an upwardly revised 638,000 (from 631,000) in June. The median sales price increased 1.8% year-over-year to $328,700 while the average sales price increased 5.9% to $394,300. Based on the current rate of sales, the inventory of new homes for sale increased to a 5.9-months' supply, versus 5.2 months in June and 5.8 months in the year-ago period. Homes priced below $400,000 accounted for 71% of new homes sold in July versus 70% in June.  Jefferies, LLC economist Ward McCarthy had this to say about the latest housing data. “Housing activity in general has retreated from levels that were temporarily boosted by 2017 natural disasters –hurricanes and wild fires— that forced displaced households to seek alternative housing. The housing sector is also undergoing an adjustment to affordability that is less attractive than it was for most of the cycle, as well as changes in the treatment of SALT deductions in the federal tax code. That is the bad news. The good news is that there is no evidence of the type of imbalances that could cause a sharp downturn, such as heavy inventories and/or rising mortgage default and delinquency rates. We also note this is not the first temporary slowdown in housing activity this cycle.” Also on Thursday, the Federal Housing Finance Agency (FHFA) released their latest House Price Index (HPI) showing home prices increased just 0.2% in June from May. Economist William Doerner said although home prices rose in the second quarter, it was at a much slower pace than previously recorded in the past four years. “Mortgage rates have increased by more than half a percentage point over the first six months of the year. Rates are still inexpensive from a historical standpoint, but their bump-up appears to have gently pressed the brakes on house price increases.” Nationally, home prices in all 50 states and the District of Columbia increased since the second quarter last year.
  States with the largest gains are Nevada (+17%), Idaho (+13%), District of Columbia (+11.8%), Utah (+11.3%) and Washington (+11%). States showing the least amount of annual appreciation are North Dakota (+2.1%), Louisiana (+2.3%), West Virginia (+2.3%), Connecticut (+2.4%) and Alaska (+2.6%). Elsewhere, the latest data from the Mortgage Bankers Association’s (MBA) weekly mortgage applications survey showed an increase in mortgage applications. The MBA reported their overall seasonally adjusted Market Composite Index (application volume) rose 4.2% during the week ended August 17, 2018. The seasonally adjusted Purchase Index increased 3.0% from the week prior while the Refinance Index jumped 6.0% higher from a week earlier. Overall, the refinance portion of mortgage activity increased to 38.7% from 37.6% of total applications from the prior week. The adjustable-rate mortgage share of activity increased to 6.5% from 6.2% of total applications. According to the MBA, the average contract interest rate for 30-year fixed-rate mortgages with a conforming loan balance was unchanged at 4.81% with points decreasing to 0.42 from 0.43 for 80 percent loan-to-value ratio (LTV) loans. For the week, the FNMA 4.0% coupon bond gained 15.6 basis points to close at $101.984 while the 10-year Treasury yield decreased 5.10 basis points to end at 2.813%. The Dow Jones Industrial Average gained 121.03 points to close at 25,790.35. The NASDAQ Composite Index advanced 129.65 points to close at 7,945.98. The S&P 500 Index added 24.56 points to close at 2,874.69. Year to date on a total return basis, the Dow Jones Industrial Average has gained 4.33%, the NASDAQ Composite Index has advanced 15.10%, and the S&P 500 Index has added 7.52%. This past week, the national average 30-year mortgage rate fell to 4.63% from 4.64%; the 15-year mortgage rate remained unchanged at 4.14%; the 5/1 ARM mortgage rate decreased to 3.95% from 3.97% while the FHA 30-year rate remained unchanged at 4.37%. Jumbo 30-year rates eased to 4.34% from 4.37%. Economic Calendar - for the Week of August 27, 2018 Economic reports having the greatest potential impact on the financial markets are highlighted in bold.
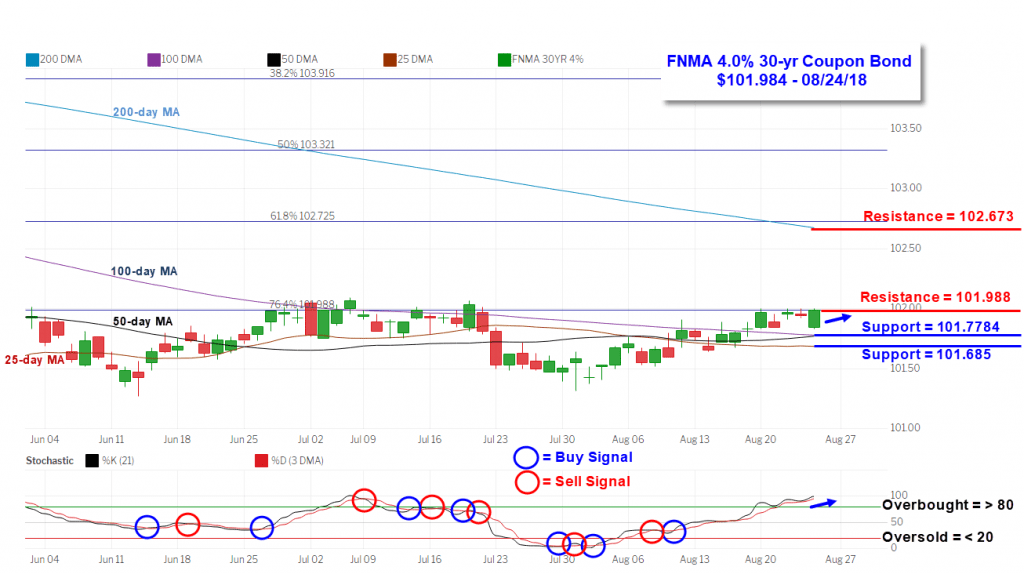
  Mortgage Rate Forecast with Chart - FNMA 30-Year 4.0% Coupon Bond The FNMA 30-year 4.0% coupon bond ($101.984, +15.6 bp) traded within a narrower 17.2 basis point range between a weekly intraday low of 101.828 on Monday and Friday and a weekly intraday high of $102.00 on Monday before closing the week at $101.984 on Friday. Mortgage bond prices traded mostly in a sideways direction between technical support provided by the 100-day moving average and overhead resistance from the 76.4% Fibonacci retracement level located at $101.988. The bond remains on a buy signal from August 10 th but is now extremely “overbought” and susceptible to a pullback toward technical support. However, support is close at hand, so we could see a continuation of a sideways trading pattern without much effect on mortgage rates. Rates should continue to show stability in the coming week
 Jefferies, LLC economist Ward McCarthy had this to say about the latest housing data. “Housing activity in general has retreated from levels that were temporarily boosted by 2017 natural disasters –hurricanes and wild fires— that forced displaced households to seek alternative housing. The housing sector is also undergoing an adjustment to affordability that is less attractive than it was for most of the cycle, as well as changes in the treatment of SALT deductions in the federal tax code. That is the bad news. The good news is that there is no evidence of the type of imbalances that could cause a sharp downturn, such as heavy inventories and/or rising mortgage default and delinquency rates. We also note this is not the first temporary slowdown in housing activity this cycle.” Also on Thursday, the Federal Housing Finance Agency (FHFA) released their latest House Price Index (HPI) showing home prices increased just 0.2% in June from May. Economist William Doerner said although home prices rose in the second quarter, it was at a much slower pace than previously recorded in the past four years. “Mortgage rates have increased by more than half a percentage point over the first six months of the year. Rates are still inexpensive from a historical standpoint, but their bump-up appears to have gently pressed the brakes on house price increases.” Nationally, home prices in all 50 states and the District of Columbia increased since the second quarter last year.
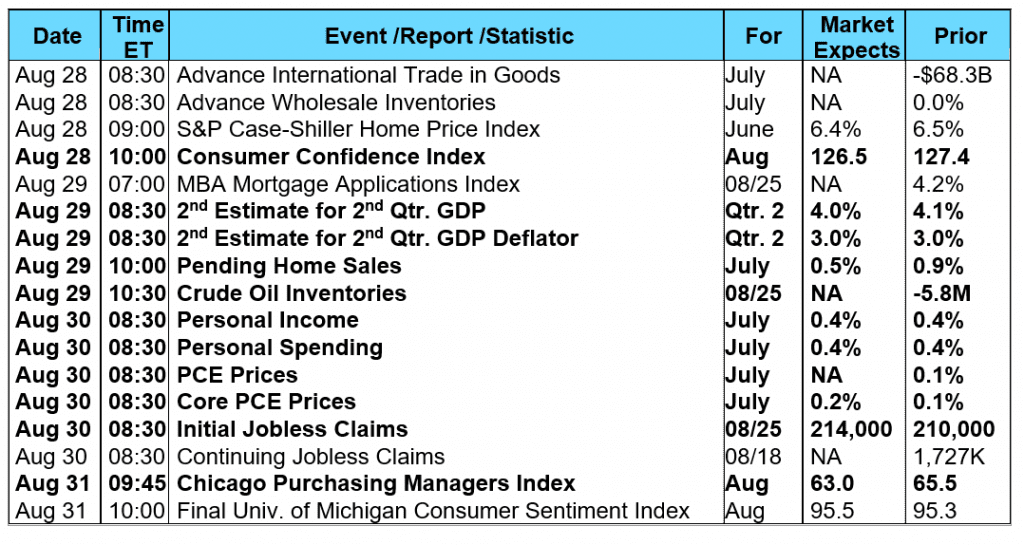
  States with the largest gains are Nevada (+17%), Idaho (+13%), District of Columbia (+11.8%), Utah (+11.3%) and Washington (+11%). States showing the least amount of annual appreciation are North Dakota (+2.1%), Louisiana (+2.3%), West Virginia (+2.3%), Connecticut (+2.4%) and Alaska (+2.6%). Elsewhere, the latest data from the Mortgage Bankers Association’s (MBA) weekly mortgage applications survey showed an increase in mortgage applications. The MBA reported their overall seasonally adjusted Market Composite Index (application volume) rose 4.2% during the week ended August 17, 2018. The seasonally adjusted Purchase Index increased 3.0% from the week prior while the Refinance Index jumped 6.0% higher from a week earlier. Overall, the refinance portion of mortgage activity increased to 38.7% from 37.6% of total applications from the prior week. The adjustable-rate mortgage share of activity increased to 6.5% from 6.2% of total applications. According to the MBA, the average contract interest rate for 30-year fixed-rate mortgages with a conforming loan balance was unchanged at 4.81% with points decreasing to 0.42 from 0.43 for 80 percent loan-to-value ratio (LTV) loans. For the week, the FNMA 4.0% coupon bond gained 15.6 basis points to close at $101.984 while the 10-year Treasury yield decreased 5.10 basis points to end at 2.813%. The Dow Jones Industrial Average gained 121.03 points to close at 25,790.35. The NASDAQ Composite Index advanced 129.65 points to close at 7,945.98. The S&P 500 Index added 24.56 points to close at 2,874.69. Year to date on a total return basis, the Dow Jones Industrial Average has gained 4.33%, the NASDAQ Composite Index has advanced 15.10%, and the S&P 500 Index has added 7.52%. This past week, the national average 30-year mortgage rate fell to 4.63% from 4.64%; the 15-year mortgage rate remained unchanged at 4.14%; the 5/1 ARM mortgage rate decreased to 3.95% from 3.97% while the FHA 30-year rate remained unchanged at 4.37%. Jumbo 30-year rates eased to 4.34% from 4.37%. Economic Calendar - for the Week of August 27, 2018 Economic reports having the greatest potential impact on the financial markets are highlighted in bold.
  Mortgage Rate Forecast with Chart - FNMA 30-Year 4.0% Coupon Bond The FNMA 30-year 4.0% coupon bond ($101.984, +15.6 bp) traded within a narrower 17.2 basis point range between a weekly intraday low of 101.828 on Monday and Friday and a weekly intraday high of $102.00 on Monday before closing the week at $101.984 on Friday. Mortgage bond prices traded mostly in a sideways direction between technical support provided by the 100-day moving average and overhead resistance from the 76.4% Fibonacci retracement level located at $101.988. The bond remains on a buy signal from August 10 th but is now extremely “overbought” and susceptible to a pullback toward technical support. However, support is close at hand, so we could see a continuation of a sideways trading pattern without much effect on mortgage rates. Rates should continue to show stability in the coming week
