
The stock market ended the week moderately lower on continuing trade tensions primarily between the U.S. and China. The Energy Sector was a notable exception as oil prices reached new four-year highs following a lower than expected U.S. oil inventory report and news the U.S. State Department would seek to enact powerful sanctions on any countries that don't cut oil imports from Iran to "zero" by November 4. The Wall Street Journal reported last Monday that U.S. officials were planning to block Chinese firms from investing in U.S. technology companies plus enacting new limits on U.S. technology exports to China. Also on Tuesday, the president told a group of White House reporters the government would continue to rely on the Committee on Foreign Investment in the United States (CFIUS) in limiting Chinese investments in U.S. technology. Blocking Chinese access to certain U.S. technologies is not only seen as a deterrent to intellectual property theft, but also appears to be a negotiating tool to craft a more favorable trade deal with China. In housing news, the Commerce Department reported last Monday that New Home Sales remained robust for the month of May, selling at a 6.7% pace higher than in April and 14.1% higher year-over-year for a seasonally adjusted annual rate of 689,000. The median sales price fell 3.3% year-over-year to $313,000 with the average sales price declining 2.6% to $378,400. Based on the current sales rate, new home inventory declined to a 5.2 months’ supply – down from April’s 5.5 month supply and 5.4 months’ supply from a year ago. Sales in the Southern Region led the way with 17.9% sales growth with the other regions showing flat to negative sales growth. The Western Region was lower by 8.7%; the Midwest was flat at 0.0%; and the Northeast was 10% lower. Wednesday, the National Association of Realtors (NAR) reported their Pending Home Sales Index fell for the fifth straight month on an annualized basis by 0.5% in May. NAR chief economist Lawrence Yun commented “Pending home sales underperformed once again in May …coming in at the second lowest level over the past year. Realtors® in most of the country continue to describe their markets as highly competitive and fast moving, but without enough new and existing inventories for sale, activity has essentially stalled.” Yun is now forecasting sales for existing homes to decrease 0.4% to 5.49 million in 2018 (down from 5.51 million in 2017) with the national median existing-home price expected to increase around 5.0%. 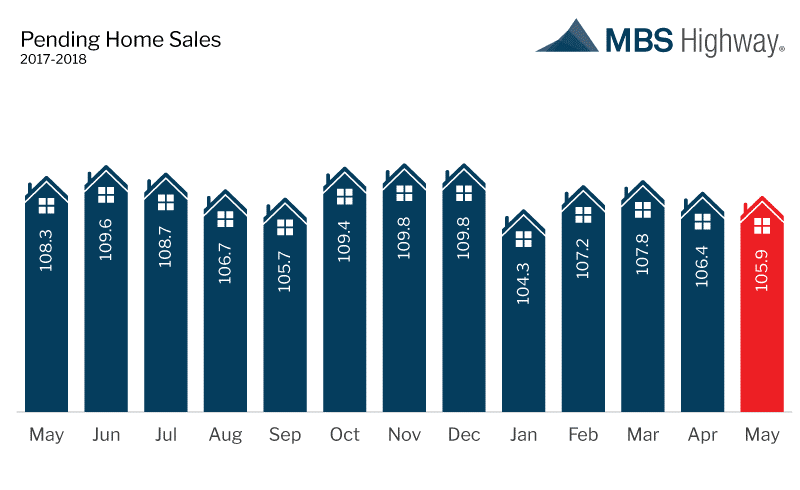 Wednesday, the latest data from the Mortgage Bankers Association’s (MBA) weekly mortgage applications survey showed a decrease in mortgage applications. The MBA reported their overall seasonally adjusted Market Composite Index (application volume) fell 4.9% during the week ended June 22, 2018. The seasonally adjusted Purchase Index decreased 6.0% from the week prior while the Refinance Index decreased by 4.0% from a week earlier. Overall, the refinance portion of mortgage activity increased to 37.6% from 36.8% of total applications from the prior week. The adjustable-rate mortgage share of activity decreased to 6.5% from 7.0% of total applications. According to the MBA, the average contract interest rate for 30-year fixed-rate mortgages with a conforming loan balance increased to 4.84% from 4.83% with points decreasing to 0.42 from 0.48. For the week, the FNMA 4.0% coupon bond gained 18.8 basis points to close at $101.922 while the 10-year Treasury yield decreased 4.04 basis points to end at 2.8600%. The Dow Jones Industrial Average lost 309.48 points to close at 24,271.41. The NASDAQ Composite Index fell 182.52 points to close at 7,510.30. The S&P 500 Index dropped 36.51 points to close at 2,718.37. Year to date on a total return basis, the Dow Jones Industrial Average has lost 1.81%, the NASDAQ Composite Index has gained 8.79%, and the S&P 500 Index has advanced 1.67%. This past week, the national average 30-year mortgage rate decreased to 4.66% from 4.70%; the 15-year mortgage rate fell to 4.11% from 4.15%; the 5/1 ARM mortgage rate increased to 4.00% from 3.99% while the FHA 30-year rate fell to 4.38% from 4.42%. Jumbo 30-year rates decreased to 4.69% from 4.73%. Economic Calendar - for the Week of July 2, 2018 Economic reports having the greatest potential impact on the financial markets are highlighted in bold.
 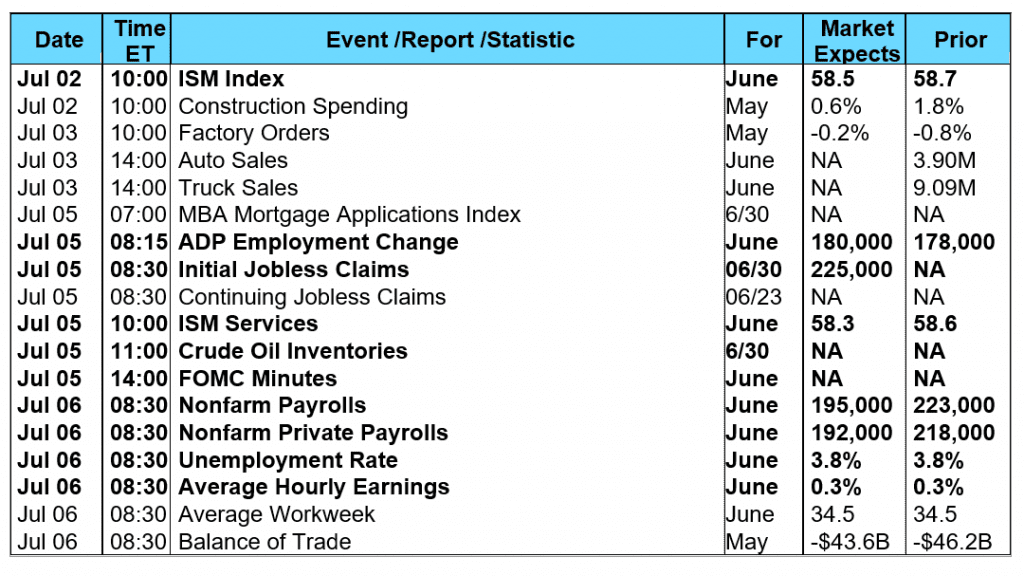 Mortgage Rate Forecast with Chart - FNMA 30-Year 4.0% Coupon Bond The FNMA 30-year 4.0% coupon bond ($101.922, +18.8 bp) traded within a wider 31.3 basis point range between a weekly intraday high of 102.016 on Thursday and a weekly intraday low of $101.703 on Monday before closing the week at $101.922 on Friday. Mortgage bonds traded in the opposite direction of the stock market, rising into a dual band of overhead resistance at the 76.4% Fibonacci retracement level ($101.988) and the 100-day moving average ($102.023). A new buy signal showed last Wednesday from a positive stochastic crossover, but it appears it wasn’t strong enough to push bond prices above resistance. Therefore, we could see some consolidation between the identified resistance and support levels ahead of this coming week’s significant economic news headlined by Friday’s Employment Report. If the jobs numbers are as or better than expected we could see the stock market rebound and bond prices slip lower. On the other hand, if the economic news is worse than forecast or trade talk becomes more antagonistic and the stock market continues to stumble, bond prices could continue to improve along with mortgage rates.
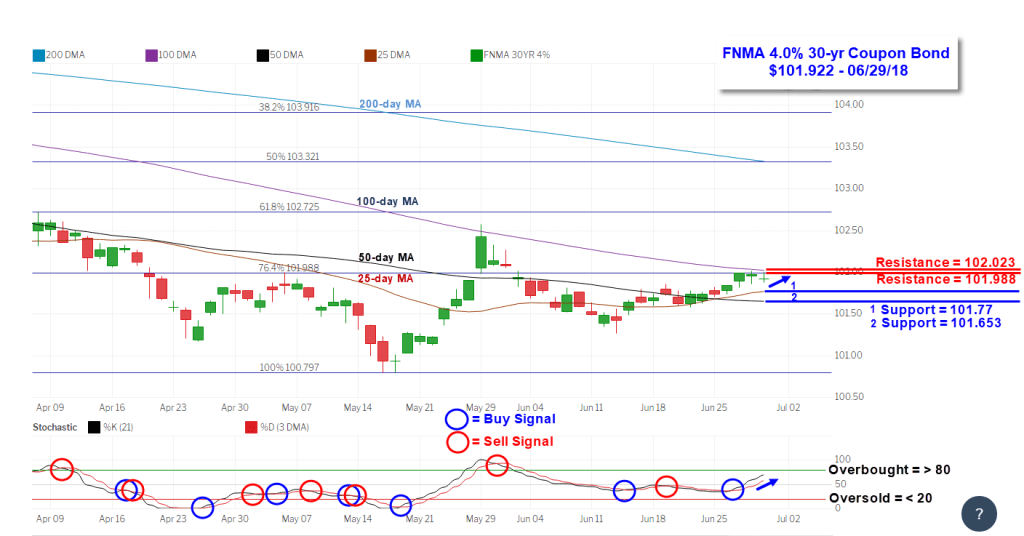
Wednesday, the latest data from the Mortgage Bankers Association’s (MBA) weekly mortgage applications survey showed a decrease in mortgage applications. The MBA reported their overall seasonally adjusted Market Composite Index (application volume) fell 4.9% during the week ended June 22, 2018. The seasonally adjusted Purchase Index decreased 6.0% from the week prior while the Refinance Index decreased by 4.0% from a week earlier. Overall, the refinance portion of mortgage activity increased to 37.6% from 36.8% of total applications from the prior week. The adjustable-rate mortgage share of activity decreased to 6.5% from 7.0% of total applications. According to the MBA, the average contract interest rate for 30-year fixed-rate mortgages with a conforming loan balance increased to 4.84% from 4.83% with points decreasing to 0.42 from 0.48. For the week, the FNMA 4.0% coupon bond gained 18.8 basis points to close at $101.922 while the 10-year Treasury yield decreased 4.04 basis points to end at 2.8600%. The Dow Jones Industrial Average lost 309.48 points to close at 24,271.41. The NASDAQ Composite Index fell 182.52 points to close at 7,510.30. The S&P 500 Index dropped 36.51 points to close at 2,718.37. Year to date on a total return basis, the Dow Jones Industrial Average has lost 1.81%, the NASDAQ Composite Index has gained 8.79%, and the S&P 500 Index has advanced 1.67%. This past week, the national average 30-year mortgage rate decreased to 4.66% from 4.70%; the 15-year mortgage rate fell to 4.11% from 4.15%; the 5/1 ARM mortgage rate increased to 4.00% from 3.99% while the FHA 30-year rate fell to 4.38% from 4.42%. Jumbo 30-year rates decreased to 4.69% from 4.73%. Economic Calendar - for the Week of July 2, 2018 Economic reports having the greatest potential impact on the financial markets are highlighted in bold. Mortgage Rate Forecast with Chart - FNMA 30-Year 4.0% Coupon Bond The FNMA 30-year 4.0% coupon bond ($101.922, +18.8 bp) traded within a wider 31.3 basis point range between a weekly intraday high of 102.016 on Thursday and a weekly intraday low of $101.703 on Monday before closing the week at $101.922 on Friday. Mortgage bonds traded in the opposite direction of the stock market, rising into a dual band of overhead resistance at the 76.4% Fibonacci retracement level ($101.988) and the 100-day moving average ($102.023). A new buy signal showed last Wednesday from a positive stochastic crossover, but it appears it wasn’t strong enough to push bond prices above resistance. Therefore, we could see some consolidation between the identified resistance and support levels ahead of this coming week’s significant economic news headlined by Friday’s Employment Report. If the jobs numbers are as or better than expected we could see the stock market rebound and bond prices slip lower. On the other hand, if the economic news is worse than forecast or trade talk becomes more antagonistic and the stock market continues to stumble, bond prices could continue to improve along with mortgage rates.