This past week the major stock market indexes traded to new all-time highs as investors became more optimistic about the incoming Trump administration's plans for economic stimulus through deregulation, reduced corporate tax rates, and leveraged infrastructure spending. The stock market may have also received a boost from traders who had taken short positions having to buy back borrowed stock to cover losing positions after the S&P 500 Index crossed above a key technical threshold at 2,225 on Wednesday. For the bond market it was a different story. The week’s economic data were, overall, supportive for investing in stocks over bonds, with positive readings for the November ISM Services Index (57.2), October Factory Orders (+2.7%), and the December Consumer Sentiment Index (98.0). Moreover, the bond market was sent reeling after the European Central Bank (ECB) decision on Thursday to reduce the amount of monthly asset purchases from 80 billion euros to 60 billion euros after March 2017, to continue through December 2017. The ECB also rejected a 12-month extension of asset purchases at the 60 billion euros per month rate because monetary policy “hawks” wanted only six months at that pace. They ended up compromising on a nine month extension and this disappointed bond traders who were looking for a longer extension period. In the realm of housing, the Mortgage Bankers Association (MBA) released their latest Mortgage Application Data for the week ending December 2 showing the overall seasonally adjusted Market Composite Index fell 0.7%. The seasonally adjusted Purchase Index rose 0.4% from the prior week, while the Refinance Index decreased 1.0%. Overall, the refinance portion of mortgage activity increased to 56.2% of total applications from 55.1%. The adjustable-rate mortgage share of activity accounted for 6.0% of total applications. According to the MBA, the average contract interest rate for 30-year fixed-rate mortgages with a conforming loan balance increased from 4.23% to 4.27% with points decreasing to 0.37 from 0.41. For the week, the FNMA 3.5% coupon bond lost 46.8 basis points to end at $ 102.14 while the 10-year Treasury yield increased 7.60 basis points to end at 2.47%. Stocks ended the week significantly higher with the major indexes setting new all-time highs. The Dow Jones Industrial Average gained 586.43 points to end at 19,756.85. The NASDAQ Composite Index added 188.85 points to close at 5,444.50, and the S&P 500 Index rose 67.58 points to close at 2,259.53. Year to date, and exclusive of any dividends, the Dow Jones Industrial Average has gained 11.80%, the NASDAQ Composite Index has added 8.03%, and the S&P 500 Index has advanced 9.54%. This past week, the national average 30-year mortgage rate increased to 4.20% from 4.13% while the 15-year mortgage rate increased to 3.40% from 3.34%. The 5/1 ARM mortgage rate rose to 3.06% from 3.03%. FHA 30-year rates increased to 3.90% from 3.85% and Jumbo 30-year rates increased to 4.25% from 4.20%.
Economic Calendar - for the Week of December 12, 2016 Economic reports having the greatest potential impact on the financial markets are highlighted in bold.
| Date | TimeET | Event /Report /Statistic | For | Market Expects | Prior |
| Dec 12 | 14:00 | Treasury Budget | Nov | -$135.0B | -$56.8B |
| Dec 13 | 08:30 | Export Prices excluding agriculture | Nov | NA | 0.2% |
| Dec 13 | 08:30 | Import Prices excluding oil | Nov | NA | -0.1% |
| Dec 14 | 07:00 | MBA Mortgage Index | 12/10 | NA | -0.7% |
| Dec 14 | 08:30 | Retail Sales | Nov | 0.3% | 0.8% |
| Dec 14 | 08:30 | Retail Sales excluding automobiles | Nov | 0.4% | 0.8% |
| Dec 14 | 08:30 | Producer Price Index (PPI) | Nov | 0.1% | 0.0% |
| Dec 14 | 08:30 | Core PPI | Nov | 0.2% | -0.2% |
| Dec 14 | 09:15 | Industrial Production | Nov | -0.1% | 0.0% |
| Dec 14 | 09:15 | Capacity Utilization | Nov | 75.1% | 75.3% |
| Dec 14 | 10:00 | Business Inventories | Oct | -0.1% | 0.1% |
| Dec 14 | 10:30 | Crude Oil Inventories | 12/10 | NA | -2.389M |
| Dec 14 | 14:00 | FOMC Rate Decision | Dec | 0.625% | 0.375% |
| Dec 15 | 08:30 | Consumer Price Index (CPI) | Nov | 0.2% | 0.4% |
| Dec 15 | 08:30 | Core CPI | Nov | 0.2% | 0.1% |
| Dec 15 | 08:30 | Initial Jobless Claims | 12/10 | 256,000 | 258,000 |
| Dec 15 | 08:30 | Continuing Jobless Claims | 12/03 | NA | 2,005K |
| Dec 15 | 08:30 | Philadelphia Fed Manufacturing Index | Dec | 9.0 | 7.6 |
| Dec 15 | 08:30 | N.Y. Empire State Manufacturing Index | Dec | 3.0 | 1.5 |
| Dec 15 | 08:30 | 3rd Quarter Current Account Balance | Qtr. 3 | -$111.6B | -$119.9B |
| Dec 15 | 10:00 | NAHB Housing Market Index | Dec | 63 | 63 |
| Dec 15 | 16:00 | Net Long-Term TIC Flows | Oct | NA | -$26.2B |
| Dec 16 | 08:30 | Housing Starts | Nov | 1,225K | 1,323K |
| Dec 16 | 08:30 | Building Permits | Nov | 1,236K | 1,229K |
Mortgage Rate Forecast with ChartFNMA 30-Year 3.5% Coupon Bond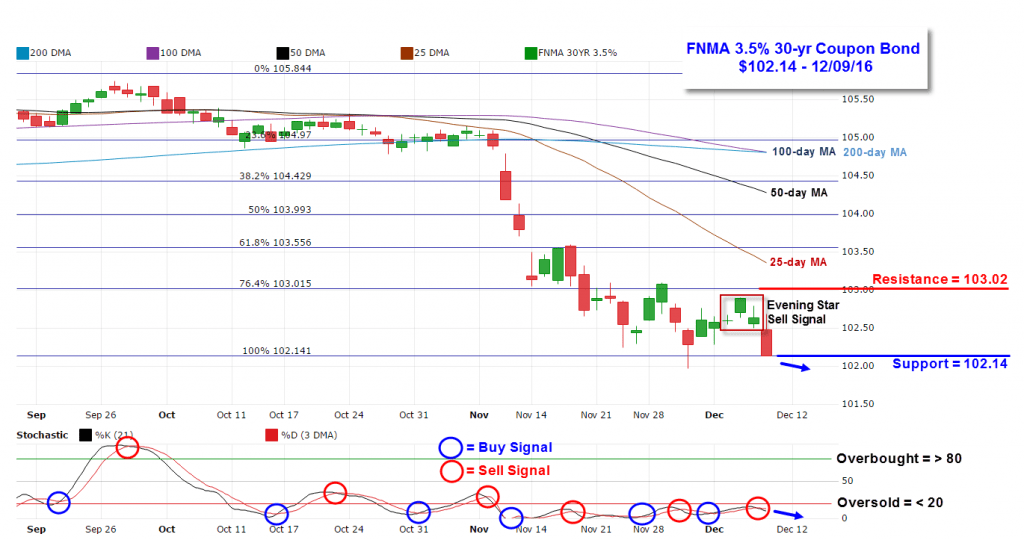
Bond prices swung higher Monday through Wednesday only to tumble lower on Thursday and Friday. The FNMA 30-year 3.5% coupon bond ($102.14, -46.8 basis points) traded within a 77 basis point range between a weekly intraday high of $102.91 on Wednesday and a weekly intraday low of $102.14 on Friday before closing the week at $102.14. Friday’s close was the week’s low price and right on the 100% Fibonacci retracement support level. A close below this level this coming week may result in a continuation lower to the next support level at $101.36 – 78 basis points lower. Should this happen, mortgage rates would move higher. The bearish case for mortgage bonds is this. The three-day candlestick pattern formed between Tuesday and Thursday was an “Evening Star” pattern and is considered to be a moderately powerful sell signal. Furthermore, the slow stochastic oscillator is showing a negative stochastic crossover sell signal. On a more bullish outlook for bonds, the stock market is “overbought” and susceptible to a correction which would help bond prices improve. The catalyst for a move lower in stocks could arrive on Wednesday when the Federal Reserve will likely raise interest rates by 25 basis points. Also, mortgage rates have historically tended to decline in the beginning of a rate increase cycle so we could see mortgage rates improve following the next rate hike. Further, the bond closed right on support while in an “oversold” position so we could see a technical bounce higher off of the $102.14 support level and this would help stabilize rates.
