
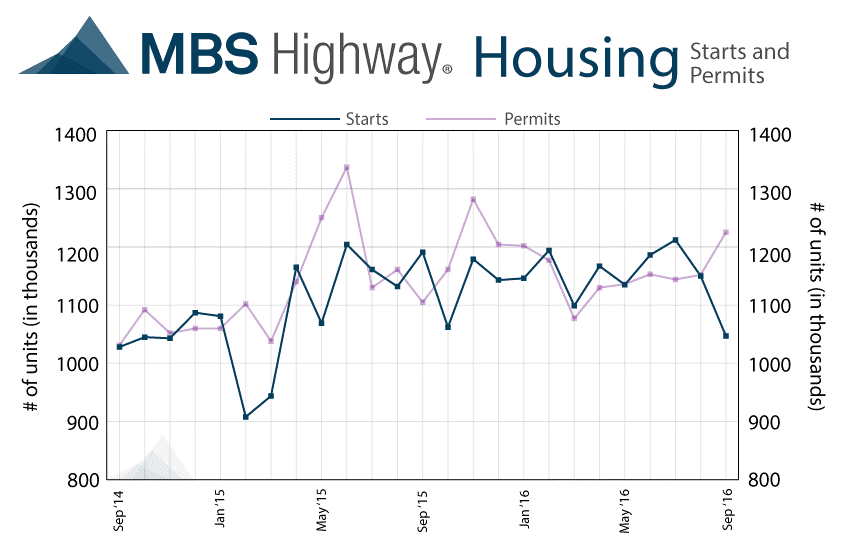
Weekly Review Both the stock and bond markets showed modest improvement during the week on “mixed” economic and third quarter corporate earnings reports. Several economic reports showed manufacturing remains tenuous. The New York Fed reported the October New York Empire State Manufacturing Index continued its recent decline by dropping to -6.8 from September’s reading of -2.0. The consensus forecast had called for rise to 2.0. Readings below zero indicate a contraction in manufacturing activity and October’s was the weakest reading since May. The Philadelphia Federal Reserve Bank reported its Manufacturing Index for October fell to a reading of 9.7 after reaching a 19 month high in September with a reading of 12.8. However, a greater pullback was expected as various consensus forecasts for October ranged from 5.5 to 7.0. The Federal Reserve reported Industrial Production increased by 0.1% month-over-month for September, but this was below the consensus forecast calling for a 0.2% gain. Capacity Utilization declined to 75.4% from 75.5% and was below the consensus forecast of 75.6% while trending 4.6% below its long-term average. This report revealed Industrial Production remains fragile while Capacity Utilization continues to be weak. However, several reports on the housing sector revealed this area of the economy remains strong. The National Association of Home Builders reported their October Housing Market Index, a measure of home builder sentiment, retreated a couple of points to 63 after hitting a decade high of 65 in September. NAHB Chairman Ed Brady remarked “Even with this month’s drop, builder confidence stands at its second-highest level in 2016, a sign that the housing recovery continues to make solid progress. However, builders in many markets continue to express concerns about shortages of lots and labor.” The Commerce Department reported Housing Starts fell to their lowest level in 18 months at an annual rate of 1.047 million when the consensus forecast had estimated 1.168 million. However, builders shifted their emphasis to building single-family homes from apartments as single-family housing starts rose 8.1% to an annual rate of 783,000, the highest in seven months. Starts for buildings with five or more units fell 39%. This emphasis on single-family construction is a sign of greater confidence in the economy. There is now the largest number of single-family homes under construction since October 2008. Moreover, the decline in Housing Starts was mostly offset by a strong showing in Building Permits suggesting a stronger rate of future construction. Building Permits were reported at 1.255 million in September, a 6.3% monthly gain and the highest number since November. 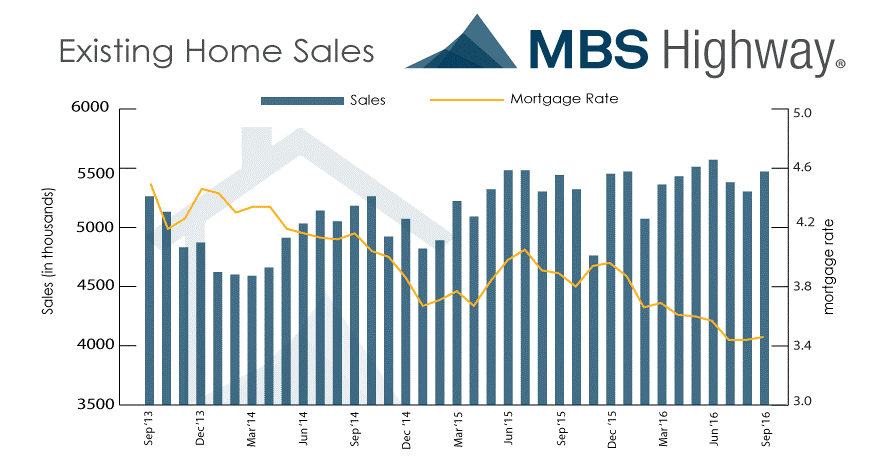 As far as mortgages are concerned, the Mortgage Bankers Association (MBA) released their latest Mortgage Application Data for the week ending October 14 th showing the overall seasonally adjusted Market Composite Index increased 0.6%. The seasonally adjusted Purchase Index rose 3.0% from the prior week, while the Refinance Index decreased 1.0%. Overall, the refinance portion of mortgage activity decreased to 61.5% of total applications from 62.4% in the prior week. The adjustable-rate mortgage share of activity accounted for 4.1% of total applications. According to the MBA, the average contract interest rate for 30-year fixed-rate mortgages with a conforming loan balance increased from 3.68% to 3.73% with points increasing to 0.36 from 0.35. For the week, the FNMA 3.0% coupon bond gained 39.1 basis points to end at $103.38 while the 10-year Treasury yield decreased 6.8 basis points to end at 1.7364%. Stocks ended the week higher with the Dow Jones Industrial Average gaining 7.33 points to end at 18,145.71. The NASDAQ Composite Index added 43.24 points to close at 5,257.40, and the S&P 500 Index rose 8.18 points to close at 2,141.16. Year to date, and exclusive of any dividends, the Dow Jones Industrial Average has gained 3.97%, the NASDAQ Composite Index has added 4.76%, and the S&P 500 Index has advanced 4.54%. This past week, the national average 30-year mortgage rate decreased to 3.54% from 3.58% while the 15-year mortgage rate decreased to 2.85% from 2.89%. The 5/1 ARM mortgage rate fell to 2.86% from 2.91%. FHA 30-year rates decreased to 3.35% from 3.40% and Jumbo 30-year rates decreased to 3.70% from 3.73%. Economic Calendar - for the Week of October 24, 2016 Economic reports having the greatest potential impact on the financial markets are highlighted in bold.
Mortgage Rate Forecast with Chart For the week, the FNMA 30-year 3.0% coupon bond ($103.38, +39.1 basis points) traded within a 45 basis point range between a weekly intraday high of $103.47 on Thursday and a weekly intraday low of $103.02 on Monday before closing the week at $103.38. The bond bounced back above the 23.6% Fibonacci retracement level at $103.19 and this level reverts back to nearest technical support. A tough triple layer of overhead resistance is found beginning with the 100-day moving average at $103.50 followed by the 25-day and 50-day moving averages at $103.54 and $103.60 respectively. The slow stochastic oscillator suggests a further advance could take place this coming week into that ceiling of resistance, but it will be difficult for the bond to move above these levels unless there is a significant meltdown in the stock market. A more likely scenario is the bond trading in a range between its nearest support and resistance levels with little resultant change in mortgage rates this coming week. Chart: FNMA 30-Year 3.0% Coupon Bond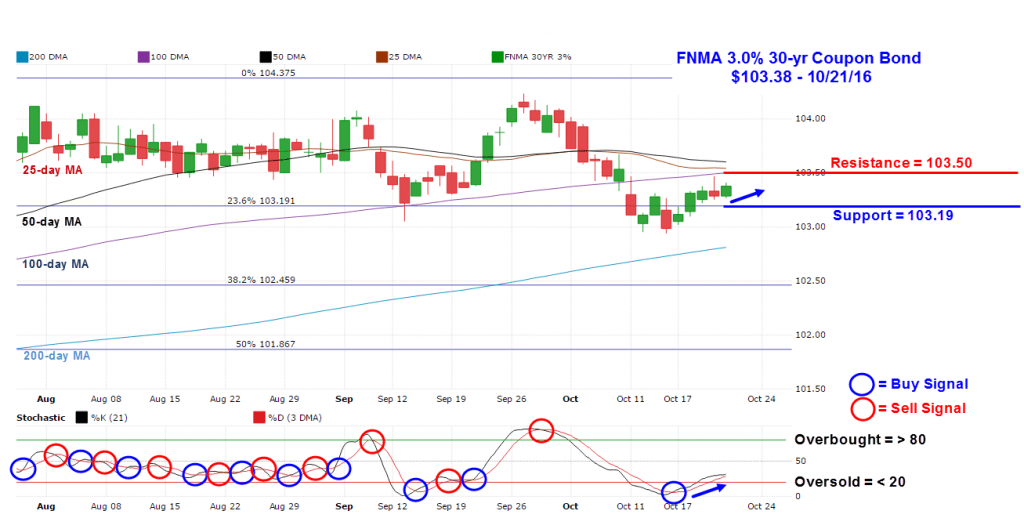
As far as mortgages are concerned, the Mortgage Bankers Association (MBA) released their latest Mortgage Application Data for the week ending October 14 th showing the overall seasonally adjusted Market Composite Index increased 0.6%. The seasonally adjusted Purchase Index rose 3.0% from the prior week, while the Refinance Index decreased 1.0%. Overall, the refinance portion of mortgage activity decreased to 61.5% of total applications from 62.4% in the prior week. The adjustable-rate mortgage share of activity accounted for 4.1% of total applications. According to the MBA, the average contract interest rate for 30-year fixed-rate mortgages with a conforming loan balance increased from 3.68% to 3.73% with points increasing to 0.36 from 0.35. For the week, the FNMA 3.0% coupon bond gained 39.1 basis points to end at $103.38 while the 10-year Treasury yield decreased 6.8 basis points to end at 1.7364%. Stocks ended the week higher with the Dow Jones Industrial Average gaining 7.33 points to end at 18,145.71. The NASDAQ Composite Index added 43.24 points to close at 5,257.40, and the S&P 500 Index rose 8.18 points to close at 2,141.16. Year to date, and exclusive of any dividends, the Dow Jones Industrial Average has gained 3.97%, the NASDAQ Composite Index has added 4.76%, and the S&P 500 Index has advanced 4.54%. This past week, the national average 30-year mortgage rate decreased to 3.54% from 3.58% while the 15-year mortgage rate decreased to 2.85% from 2.89%. The 5/1 ARM mortgage rate fell to 2.86% from 2.91%. FHA 30-year rates decreased to 3.35% from 3.40% and Jumbo 30-year rates decreased to 3.70% from 3.73%. Economic Calendar - for the Week of October 24, 2016 Economic reports having the greatest potential impact on the financial markets are highlighted in bold. | Date | TimeET | Event /Report /Statistic | For | Market Expects | Prior |
| Oct 25 | 09:00 | Case-Shiller 20-city Index | Aug | 5.1% | 5.0% |
| Oct 25 | 09:00 | FHFA Housing Price Index | Aug | NA | 0.5% |
| Oct 25 | 10:00 | Consumer Confidence | Oct | 100.8 | 104.1 |
| Oct 26 | 07:00 | MBA Mortgage Index | 10/22 | NA | -0.6% |
| Oct 26 | 08:30 | International Trade in Goods | Sept | NA | -$58.4B |
| Oct 26 | 10:00 | New Home Sales | Sept | 610,000 | 609,000 |
| Oct 26 | 10:30 | Crude Oil Inventories | 10/22 | NA | -5.247M |
| Oct 27 | 08:30 | Initial Jobless Claims | 10/22 | 259,000 | 260,000 |
| Oct 27 | 08:30 | Continuing Jobless Claims | 10/15 | NA | 2,057K |
| Oct 27 | 08:30 | Durable Goods Orders | Sept | 0.0% | 0.0% |
| Oct 27 | 08:30 | Durable Goods Orders Excluding Transportation | Sept | 0.3% | -0.4% |
| Oct 27 | 10:00 | Pending Home Sales | Sept | 0.6% | -2.4% |
| Oct 28 | 08:30 | Advance 3rd Qtr. GDP | Qtr. 3 | 2.5% | 1.4% |
| Oct 28 | 08:30 | Advance 3rd Qtr. Chain Deflator | Qtr. 3 | 1.4% | 2.3% |
| Oct 28 | 08:30 | Employment Cost Index | Qtr. 3 | 0.6% | 0.6% |
| Oct 28 | 10:00 | Final Univ. Michigan Consumer Sentiment Index | Oct | 88.2 | 87.9 |