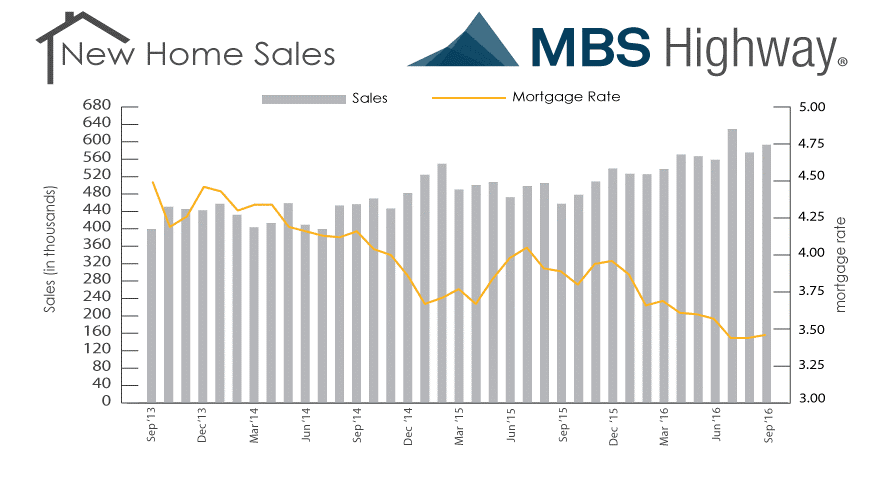
Encouraging economic news during the week resulted in rising bond yields and lower bond prices while stock prices put in an uneven performance on mixed third quarter corporate earnings reports. Disappointing third quarter earnings reports from Apple, 3M, Caterpillar, and Sherwin-Williams in addition to poor fourth quarter earnings guidance from retailers Under Armour, Kohl's, and Macy's helped to weigh on the stock market. In economic news, the economy unexpectedly showed signs of improvement in the 3rd Quarter by growing at the fastest pace in two years. According to the Commerce Department’s Bureau of Economic Analysis, 3rd Quarter GDP bounced back at a 2.9% annual rate after growing by only a 1.4% annual rate in the 2nd Quarter. On the inflation front, the Advance 3rd Quarter Chain Deflator was reported at 1.5%, a little higher than the consensus forecast of 1.4%, but well below the 2nd Quarter’s level of 2.3%. The 3rd Quarter Employment Cost Index matched both the consensus forecast and the 2nd Quarter result at 0.6%. Wages and salaries increased 0.5% while benefits increased 0.7%. For the 12-month period ending in September, compensation costs for civilian and private industry workers both increased 2.3% while those for state and local government workers increased 2.6%. Apparently, it pays a little better to work for the government. The week’s housing news was favorable with the Case-Shiller 20-City Home Price Index, which measures price changes in residential housing in 20 major cities across the U.S., moving 0.4% higher for the month August and 5.1% higher year-over-year. The overall Case-Shiller Index measuring price changes in all nine U.S. census divisions across the U.S. was 5.3% higher on an annual basis in August from 5.0% in July. Also, the FHFA Home Price Index for August increased 0.7% and this exceeded the consensus forecast of 0.5%. On an annual basis, the FHFA Home Price Index was 6.4% higher. New Home Sales were mostly upbeat. The Census Bureau reported New Home Sales increased 3.1% to a seasonally adjusted annual rate of 593,000 in September. This was below the consensus forecast of 610,000 but higher than a downwardly revised level of 575,000 in August. Additionally, the September 2016 rate is 29.8% higher than the September 2015 rate of 457,000. Furthermore, the median sales price for new homes sold in September jumped by $29,500 to $313,500 from $284,000 in August while the average sales price increased by $24,100 to $377,700. At the current sales rate, there is currently a 4.8 month supply of 235,000 new homes available for purchase.
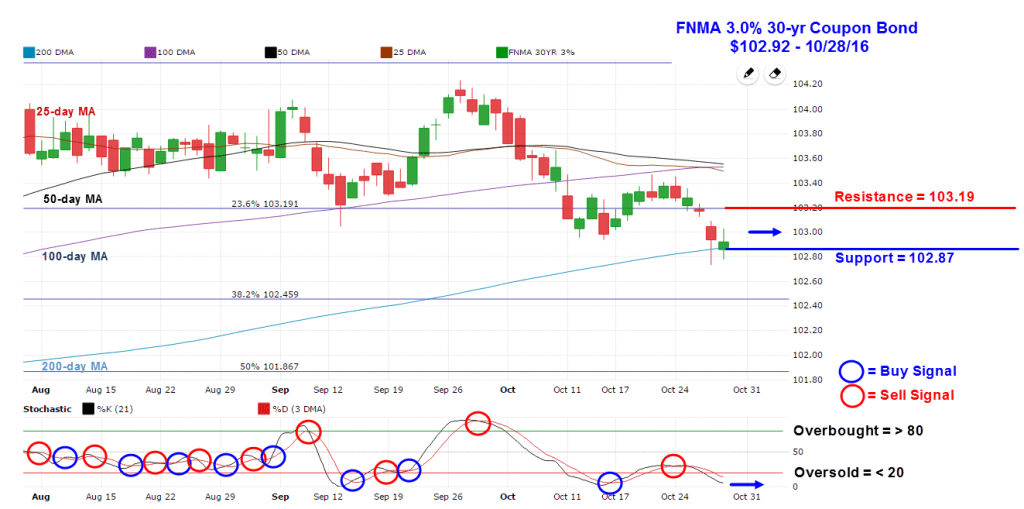
Mortgage Rate Forecast with Chart For the week, the FNMA 30-year 3.0% coupon bond ($102.92, -45.3 basis points) traded within a wider 72 basis point range between a weekly intraday high of $103.45 on Monday and a weekly intraday low of $102.73 on Thursday before closing the week at $102.92. More favorable than anticipated economic data drove bond prices lower through technical support at the 23.6% Fibonacci retracement level at $103.19, and this level now reverts to nearest overhead resistance with technical support found at the key 200-day moving average at $102.87. The bond is “oversold” at this point and could make a turn higher this week to stabilize mortgage rates. However, an abundance of major economic news is scheduled for release this week, and if the data proves to be favorable for the economy, we could see bond prices pushed below the 200-day moving average toward the next level of support at the 38.2% Fibonacci retracement level at $102.46. Should this occur mortgage rates would move slightly higher. Chart: FNMA 30-Year 3.0% Coupon Bond
| Date | TimeET | Event /Report /Statistic | For | Market Expects | Prior |
| Oct 31 | 08:30 | Personal Income | Sept | 0.4% | 0.2% |
| Oct 31 | 08:30 | Personal Spending | Sept | 0.5% | 0.0% |
| Oct 31 | 08:30 | Core PCE Price Index | Sept | 0.1% | 0.2% |
| Oct 31 | 09:45 | Chicago Purchasing Managers Index (PMI) | Oct | 54.0 | 54.2 |
| Nov 01 | 10:00 | ISM Index | Oct | 51.7 | 51.5 |
| Nov 01 | 10:00 | Construction Spending | Sept | 0.5% | -0.7% |
| Nov 02 | 07:00 | MBA Mortgage Index | 10/29 | NA | -4.1% |
| Nov 02 | 08:15 | ADP Employment Change | Oct | 165,000 | 154,000 |
| Nov 02 | 10:30 | Crude Oil Inventories | 10/29 | NA | -0.553M |
| Nov 02 | 14:00 | FOMC Rate Decision | Nov | 0.375% | 0.375% |
| Nov 03 | 07:30 | Challenger Job Cuts | Oct | NA | -24.7% |
| Nov 03 | 08:30 | Initial Jobless Claims | 10/29 | 256,000 | 258,000 |
| Nov 03 | 08:30 | Continuing Jobless Claims | 10/22 | NA | 2,039K |
| Nov 03 | 08:30 | Preliminary Productivity | Qtr. 3 | 1.8% | -0.6% |
| Nov 03 | 08:30 | Unit Labor Costs | Qtr. 3 | 1.2% | 4.3% |
| Nov 03 | 10:00 | Factory Orders | Sept | 0.2% | 0.2% |
| Nov 03 | 10:00 | ISM Services Index | Oct | 55.8 | 57.1 |
| Nov 04 | 08:30 | Nonfarm Payrolls | Oct | 175,000 | 156,000 |
| Nov 04 | 08:30 | Nonfarm Private Payrolls | Oct | 170,000 | 167,000 |
| Nov 04 | 08:30 | Hourly Earnings | Oct | 0.3% | 0.2% |
| Nov 04 | 08:30 | Unemployment Rate | Oct | 4.9% | 5.0% |
| Nov 04 | 08:30 | Average Workweek | Oct | 34.4 | 34.4 |
| Nov 04 | 08:30 | Trade Balance | Sept | -$38.5B | -$40.7B |