Stock prices fell during the week while bond prices posted modest gains with slightly lower yields as traders were confronted by heightened uncertainty surrounding the upcoming presidential election. Plunging oil prices also weighed on stock market sentiment as the latest report from the U.S. Energy Information Administration showed a huge 14.4 million barrel buildup in crude oil inventories. By the end of the week, the S&P 500 Index notched its ninth consecutive daily decline, its longest uninterrupted losing streak in 36 years. The daily declines were fairly minor as the market seemed to undergo a “death by a thousand cuts.” Wall Street always favors “certainty” over “uncertainty” and many on the Street believed Hillary Clinton had the election all but wrapped up. However, reports of new scandals and corruption surrounding the Clintons and the Clinton Foundation improved polling results for Donald Trump, showing Trump has closed the polling gap with Clinton. For whatever reason, this amplified feelings of political uncertainty among traders resulting in lower stock and higher bond prices. The week’s economic reports were generally positive with Personal Income and Spending both logging healthy gains in September. Personal Income increased 0.3% or $46.7 billion while Personal Spending increased 0.5% or $59.7 billion. The week’s most significant report was Friday’s Employment Situation Summary for October showing Nonfarm Payrolls increased by 161,000 while Nonfarm Private Payrolls rose by 142,000. Although these payrolls numbers slightly missed their consensus estimates, they were offset by upward revisions for August and September that combined for 44,000 jobs more than were previously reported. The employment data indicated the labor market remains strong and will keep the Federal Reserve on track to raise interest rates at their December 14 FOMC meeting. The probability for a rate hike at this meeting is currently 66.8%. Elsewhere, the Mortgage Bankers Association (MBA) released their latest Mortgage Application Data for the week ending October 28 showing the overall seasonally adjusted Market Composite Index fell 1.2%. The seasonally adjusted Purchase Index dropped 0.4% from the prior week, while the Refinance Index decreased 2.0%. Overall, the refinance portion of mortgage activity was unchanged at 62.7% of total. The adjustable-rate mortgage share of activity accounted for 4.4% of total applications. According to the MBA, the average contract interest rate for 30-year fixed-rate mortgages with a conforming loan balance increased from 3.71% to 3.75% with points decreasing to 0.36 from 0.37. For the week, the FNMA 3.0% coupon bond gained 18.7 basis points to end at $103.11 while the 10-year Treasury yield decreased 7.1 basis points to end at 1.7780%. Stocks ended the week lower with the Dow Jones Industrial Average falling 272.91 points to end at 17,888.28. The NASDAQ Composite Index dropped 143.73 points to close at 5,046.37, and the S&P 500 Index lost 41.23 points to close at 2,085.18. Year to date, and exclusive of any dividends, the Dow Jones Industrial Average has gained 2.59%, the NASDAQ Composite Index has added 0.77%, and the S&P 500 Index has advanced 1.98%. This past week, the national average 30-year mortgage rate decreased to 3.59% from 3.60% while the 15-year mortgage rate remained unchanged at 2.90%. The 5/1 ARM mortgage rate fell to 2.89% from 2.92%. FHA 30-year rates were unchanged at 3.40% and Jumbo 30-year rates were also unchanged at 3.75%.
Economic Calendar - for the Week of November 7, 2016 Economic reports having the greatest potential impact on the financial markets are highlighted in bold.
| Date | TimeET | Event /Report /Statistic | For | Market Expects | Prior |
| Nov 07 | 03:00 | Consumer Credit | Sept | $17.5B | $25.9B |
| Nov 08 | 10:00 | Job Openings / JOLTS Report | Sept | NA | 5.443M |
| Nov 09 | 07:00 | MBA Mortgage Index | 11/05 | NA | -1.2% |
| Nov 09 | 10:00 | Wholesale Inventories | Sept | 0.2% | -0.2% |
| Nov 09 | 10:30 | Crude Oil Inventories | 11/05 | NA | 14.420M |
| Nov 10 | 08:30 | Initial Jobless Claims | 11/05 | 262,000 | 265,000 |
| Nov 10 | 08:30 | Continuing Jobless Claims | 10/29 | NA | 2,026K |
| Nov 10 | 14:00 | Treasury Budget | Oct | NA | -$136.6B |
| Nov 11 | 10:00 | Univ. of Michigan Consumer Sentiment Index | Nov | 87.9 | 87.2 |
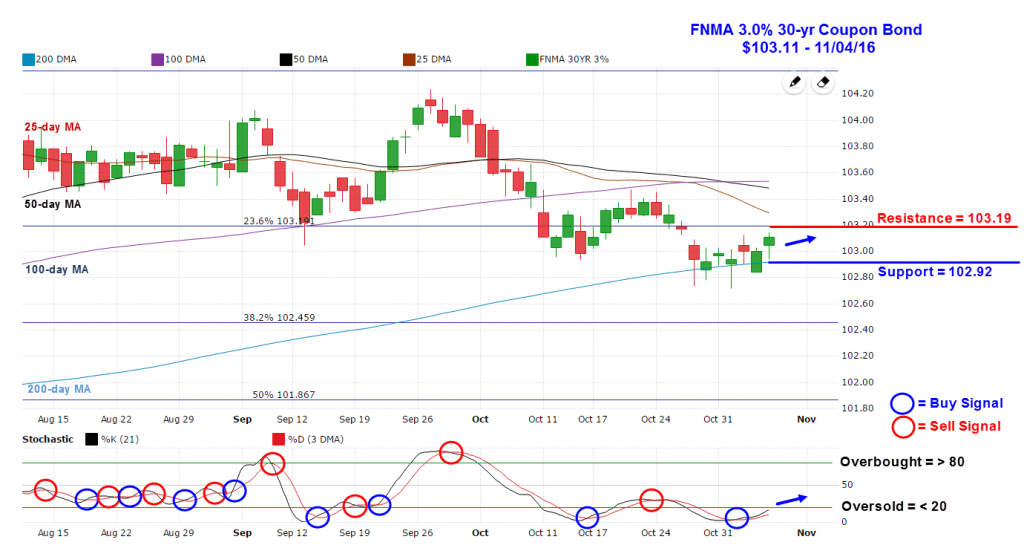
Mortgage Rate Forecast with Chart For the week, the FNMA 30-year 3.0% coupon bond ($103.11, +18.7 basis points) traded within a narrower 42 basis point range between a weekly intraday high of $103.14 on Friday and a weekly intraday low of $102.72 on Tuesday before closing the week at $103.11. The bond traded in a “sideways” direction during the week while trading between key technical support at the 200-day moving average at $102.92 and resistance at the 23.6% Fibonacci retracement level located at $103.19. Trading this past week was very choppy ahead of the presidential election which has introduced a heightened level of uncertainty in the financial markets. The slow stochastic oscillator remains “oversold” but is now making a turn higher indicating a pick-up in upward momentum. If Trump pulls out an election victory, we could see bond prices move higher with yields falling and this would help to improve mortgage rates.
Chart: FNMA 30-Year 3.0% Coupon Bond