The major stock market indexes pulled back modestly from all-time highs reached the previous week to record its first weekly decline since the middle of January. A crude oil inventory report on Thursday showing a sharp increase in supply sent oil prices below $50 a barrel for the first time since December. This triggered selling in energy stocks to help push the overall market lower. Economic news reinforced a growing conviction the Federal Reserve will indeed raise interest rates at its upcoming monetary policy meeting on March 15. As of market close on Friday, the Fed Fund futures prices have priced in an 88.6% probability the Fed will raise rates by 25 basis points. Longer-dated Treasury yields increased during the week with the yield on the 10-year Treasury note reaching its highest level since the middle of December. The financial markets spent most of the week waiting for and focusing on the release of the February employment data. Wednesday, the ADP Employment report was released showing the largest surge in private payrolls in over a decade. Friday’s official Employment Situation Summary from the Department of Labor was also strong, showing an increase of 235,000 jobs for the month. Average Hourly Earnings gained 0.2% and were revised higher for previous months to indicate a rising trend toward an annualized growth rate of 3%, suggesting future inflation. Mortgage application volume declined during the week ending March 3. The Mortgage Bankers Association (MBA) reported their overall seasonally adjusted Market Composite Index (application volume) rose by 3.3%. The seasonally adjusted Purchase Index advanced 2.0% from the prior week, while the Refinance Index increased 5.0%. Overall, the refinance portion of mortgage activity increased to 45.4% of total applications from 45.1% from the prior week. The adjustable-rate mortgage share of activity advanced to its highest level since October 2014 to 7.7% of total applications. According to the MBA, the average contract interest rate for 30-year fixed-rate mortgages with a conforming loan balance increased to 4.36% from 4.30% with points increasing to 0.44 from 0.38. For the week, the FNMA 3.5% coupon bond declined 76.6 basis points to close at $101.11 while the 10-year Treasury yield increased 9.29 basis points to end at 2.575%. Stocks ended the week lower. The Dow Jones Industrial Average fell 102.73 points to end at 20,902.798. The NASDAQ Composite Index declined 9.02 points to close at 5,861.73 and the S&P 500 Index retreated 10.52 points to close at 2,372.60. Year to date, the Dow Jones Industrial Average has gained 5.77%, the NASDAQ Composite Index has advanced 8.89%, and the S&P 500 Index has gained 5.97%. This past week, the national average 30-year mortgage rate rose to 4.35% from 4.25%; the 15-year mortgage rate increased to 3.57% from 3.45%; the 5/1 ARM mortgage rate rose to 3.13% from 3.10%; and the FHA 30-year rate increased to 4.00% from 3.85%. Jumbo 30-year rates rose from 4.39% to 4.54%.
Economic Calendar - for the Week of March 6, 2017 Economic reports having the greatest potential impact on the financial markets are highlighted in bold.
| Date | TimeET | Event /Report /Statistic | For | Market Expects | Prior |
| Mar 14 | 08:30 | Producer Price Index (PPI) | Feb | 0.1% | 0.6% |
| Mar 14 | 08:30 | Core PPI | Feb | 0.2% | 0.4% |
| Mar 15 | 07:00 | MBA Mortgage Index | 03/11 | NA | 3.3% |
| Mar 15 | 08:30 | Consumer Price Index (CPI) | Feb | 0.1% | 0.6% |
| Mar 15 | 08:30 | Core CPI | Feb | 0.2% | 0.3% |
| Mar 15 | 08:30 | Retail Sales | Feb | 0.1% | 0.4% |
| Mar 15 | 08:30 | Retail Sales excluding automobiles | Feb | 0.1% | 0.8% |
| Mar 15 | 08:30 | NY Empire State Manufacturing Index | Mar | 14.5 | 18.7 |
| Mar 15 | 10:00 | Business Inventories | Jan | 0.3% | 0.4% |
| Mar 15 | 10:00 | NAHB Housing Market Index | Mar | 65 | 65 |
| Mar 15 | 10:30 | Crude Oil Inventories | 03/11 | NA | +8.2M |
| Mar 15 | 14:00 | FOMC Rate Decision | Mar | 0.875% | 0.625% |
| Mar 15 | 16:00 | Net Long-Term TIC Flows | Mar | NA | -$12.9B |
| Mar 16 | 08:30 | Housing Starts | Feb | 1260K | 1,246K |
| Mar 16 | 08:30 | Building Permits | Feb | 1251K | 1,285K |
| Mar 16 | 08:30 | Initial Jobless Claims | 03/11 | 242K | 243,000 |
| Mar 16 | 08:30 | Continuing Jobless Claims | 03/04 | NA | 2,058K |
| Mar 16 | 08:30 | Philadelphia Fed Manufacturing Index | Mar | 25.0 | 43.3 |
| Mar 16 | 10:00 | JOLTS Job Openings | Jan | NA | 5.501M |
| Mar 17 | 09:15 | Industrial Production | Feb | 0.2% | -0.3% |
| Mar 17 | 09:15 | Capacity Utilization | Feb | 75.4% | 75.3% |
| Mar 17 | 10:00 | Index of Leading Economic Indicators | Feb | 0.5% | 0.6% |
| Mar 17 | 10:00 | Univ. of Michigan Consumer Sentiment Index | Mar | 96.8 | 96.3 |
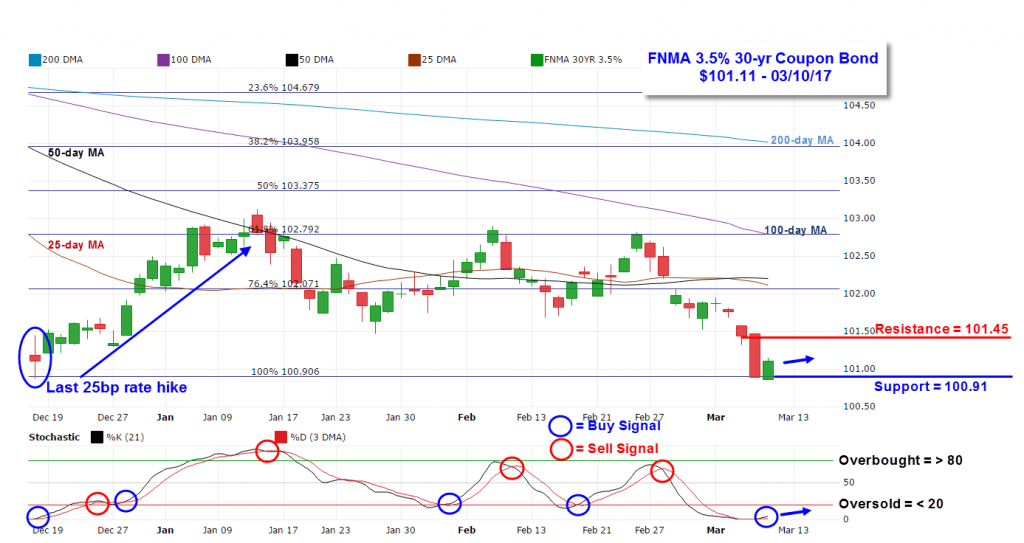
Mortgage Rate Forecast with Chart - FNMA 30-Year 3.5% Coupon Bond The FNMA 30-year 3.5% coupon bond ($101.11, -76.6 bp) traded within a slightly narrower 109 basis point range between a weekly intraday high of $101.95 on Monday and a weekly intraday low of $100.86 on Friday before closing the week at $101.11. The chart shows bond prices failed to improve even though technical signals were slightly positive at the start of the week. Bond prices continued to trend lower during the week until bouncing off of a support level at the 100% Fibonacci retracement level located at $100.91. Overhead technical resistance is now found at former support at $101.45. The slow stochastic oscillator shows bonds are at an extremely “oversold” position while also showing a positive stochastic crossover buy signal suggesting bond prices could continue to bounce higher toward resistance. Wednesday, the Fed’s FOMC will likely raise interest rates by 25 basis points. The last rate hike happened on December 16, 2016, and the bond’s price subsequently improved by 170 basis points by January 12, 2017. We will have to wait and see if history repeats itself once more resulting in improving mortgage rates.