
This past week the stock market continued to move higher with the NASDAQ Composite Index, the small-cap Russell 2000 Index, and the S&P 500 index recording new highs. Investors shifted their focus to the Trump administration’s announcement of a new tax plan that sounded beneficial to the economy and middle class, but will require many details to be negotiated. Then again with Congress’s recent track record of legislative failure, especially in the Senate, passage of a tax system overhaul remains far from certain. Furthermore, the proposed new tax plan fueled expectations the plan would significantly add to the federal budget deficit and result in a significant increase in the issuance of Treasury bonds to help pay for tax cuts. This sentiment helped push bond prices lower raising long-term yields with the yield on the 10-year Treasury note reaching its highest level since July. After all, most people realize the federal government never meaningfully cuts it’s out of control spending to balance its budget. In housing, the Commerce Department reported last Tuesday that New Home Sales fell to a seasonally adjusted annual rate of 560,000 or 3.4% month-over-month in August, the lowest level since December 2016. The consensus forecast had projected sales of 577,000, a 3.3% increase. However, New Home Sales for July were revised higher to 580,000 from an initially reported 571,000. The median sales price increased 0.4% year-over-year to $300,200 while the available inventory of new homes for sale represented a supply of 6.1 months at the current sales rate, an increase from 5.7 months in July. 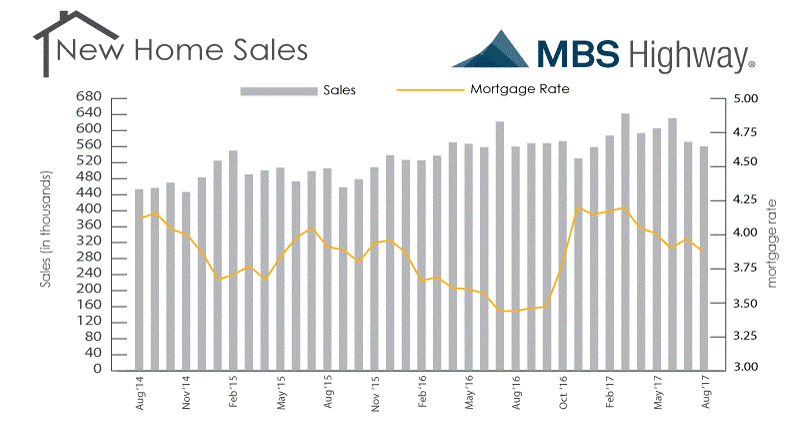 Additionally, the National Association of Realtors' released their Pending Home Sales Index for August showing a 2.6% decline in sales compared to July. The drop in sales was larger than expected as economists had forecast only a -0.4% sales decline. A drop in housing supply coupled with ever rising home prices were largely to blame for the sales decline although the devastation caused by Hurricanes Harvey and Irma were contributing factors.
 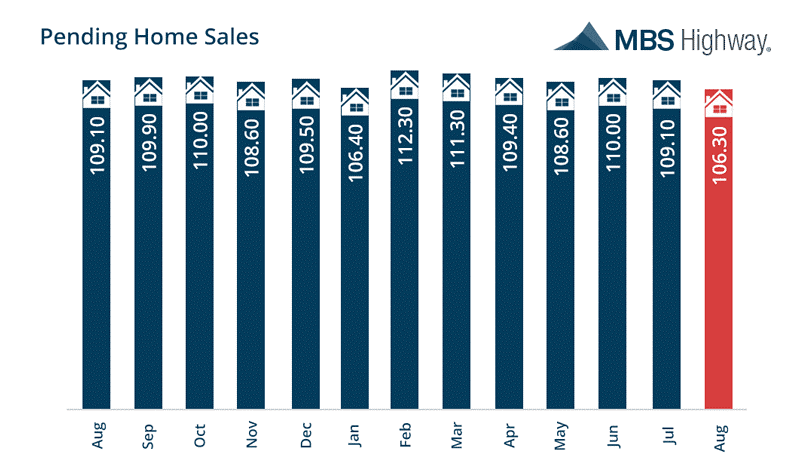 However, mortgage application volume increased during the week ending September 22. The Mortgage Bankers Association (MBA) reported their overall seasonally adjusted Market Composite Index (application volume) slipped lower by 0.5%. The seasonally adjusted Purchase Index increased 3.0% from the prior week while the Refinance Index fell 4.0%. Overall, the refinance portion of mortgage activity decreased to 50.8% of total applications from 52.1% in the prior week. The adjustable-rate mortgage share of activity decreased to 6.5% of total applications from 6.8%. According to the MBA, the average contract interest rate for 30-year fixed-rate mortgages with a conforming loan balance increased to 4.11% from 4.04% with points remaining unchanged at 0.40. For the week, the FNMA 3.5% coupon bond lost 21.8 basis points to close at $103.016. The 10-year Treasury yield increased 8.56 basis points to end at 2.3390%. The major stock indexes ended the week higher. The Dow Jones Industrial Average gained 55.5 points to close at 22,405.09. The NASDAQ Composite Index increased 69.04 points to close at 6,495.96 and the S&P 500 Index advanced 17.14 points to close at 2,519.36. Year to date on a total return basis, the Dow Jones Industrial Average has gained 13.37%, the NASDAQ Composite Index has advanced 20.67%, and the S&P 500 Index has added 12.53%. This past week, the national average 30-year mortgage rate remained at 3.97%; the 15-year mortgage rate decreased to 3.24% from 3.27%; the 5/1 ARM mortgage rate rose to 3.21% from 3.20% and the FHA 30-year rate was unchanged at 3.60%. Jumbo 30-year rates decreased to 4.17% from 4.20%. Economic Calendar - for the Week of October 2, 2017 Economic reports having the greatest potential impact on the financial markets are highlighted in bold.
 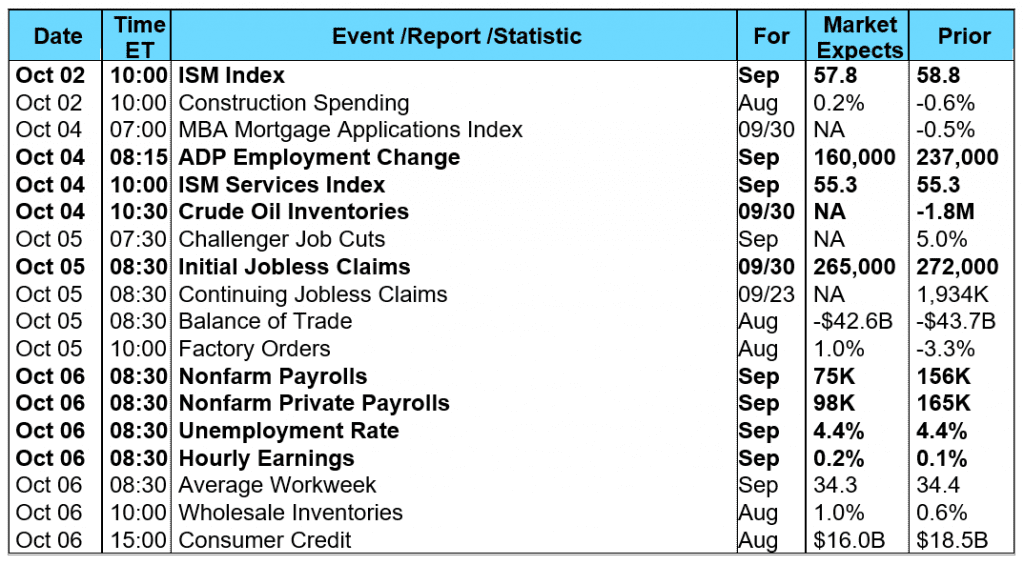 Mortgage Rate Forecast with Chart - FNMA 30-Year 3.5% Coupon Bond The FNMA 30-year 3.5% coupon bond ($103.016, -21.8 bp) traded within a 43.7 basis point range between a weekly intraday low of $102.969 on Thursday and a weekly intraday high of $103.406 on Tuesday before closing the week at $103.016 on Friday. Mortgage bond prices moved higher last Monday and Tuesday only to be turned away by overhead resistance at the 25-day moving average ($103.40) on Wednesday. Weakness the remainder of the week drove prices below the 50-day ($103.26) and 100-day ($103.08) moving averages. Closest support is found at $103.00 with the 38.2% Fibonacci retracement level at $102.806 providing secondary technical support. Technical signals are currently bearish suggesting a further test of support levels. A failure of support at $103 could lead to a slight worsening of mortgage rates this coming week with the September Employment Situation Summary (Jobs Report) on Friday serving as a further catalyst for possibly significant price movement.
Additionally, the National Association of Realtors' released their Pending Home Sales Index for August showing a 2.6% decline in sales compared to July. The drop in sales was larger than expected as economists had forecast only a -0.4% sales decline. A drop in housing supply coupled with ever rising home prices were largely to blame for the sales decline although the devastation caused by Hurricanes Harvey and Irma were contributing factors. However, mortgage application volume increased during the week ending September 22. The Mortgage Bankers Association (MBA) reported their overall seasonally adjusted Market Composite Index (application volume) slipped lower by 0.5%. The seasonally adjusted Purchase Index increased 3.0% from the prior week while the Refinance Index fell 4.0%. Overall, the refinance portion of mortgage activity decreased to 50.8% of total applications from 52.1% in the prior week. The adjustable-rate mortgage share of activity decreased to 6.5% of total applications from 6.8%. According to the MBA, the average contract interest rate for 30-year fixed-rate mortgages with a conforming loan balance increased to 4.11% from 4.04% with points remaining unchanged at 0.40. For the week, the FNMA 3.5% coupon bond lost 21.8 basis points to close at $103.016. The 10-year Treasury yield increased 8.56 basis points to end at 2.3390%. The major stock indexes ended the week higher. The Dow Jones Industrial Average gained 55.5 points to close at 22,405.09. The NASDAQ Composite Index increased 69.04 points to close at 6,495.96 and the S&P 500 Index advanced 17.14 points to close at 2,519.36. Year to date on a total return basis, the Dow Jones Industrial Average has gained 13.37%, the NASDAQ Composite Index has advanced 20.67%, and the S&P 500 Index has added 12.53%. This past week, the national average 30-year mortgage rate remained at 3.97%; the 15-year mortgage rate decreased to 3.24% from 3.27%; the 5/1 ARM mortgage rate rose to 3.21% from 3.20% and the FHA 30-year rate was unchanged at 3.60%. Jumbo 30-year rates decreased to 4.17% from 4.20%. Economic Calendar - for the Week of October 2, 2017 Economic reports having the greatest potential impact on the financial markets are highlighted in bold. Mortgage Rate Forecast with Chart - FNMA 30-Year 3.5% Coupon Bond The FNMA 30-year 3.5% coupon bond ($103.016, -21.8 bp) traded within a 43.7 basis point range between a weekly intraday low of $102.969 on Thursday and a weekly intraday high of $103.406 on Tuesday before closing the week at $103.016 on Friday. Mortgage bond prices moved higher last Monday and Tuesday only to be turned away by overhead resistance at the 25-day moving average ($103.40) on Wednesday. Weakness the remainder of the week drove prices below the 50-day ($103.26) and 100-day ($103.08) moving averages. Closest support is found at $103.00 with the 38.2% Fibonacci retracement level at $102.806 providing secondary technical support. Technical signals are currently bearish suggesting a further test of support levels. A failure of support at $103 could lead to a slight worsening of mortgage rates this coming week with the September Employment Situation Summary (Jobs Report) on Friday serving as a further catalyst for possibly significant price movement.