Stock market investors suffered a tough week of losses while being bombarded by global economic news that turned out to be a mixed bag. Some of the news was decent, but most was disappointing, resulting in a degree of market instability. Monday, financial markets got off to a rough beginning for the month of February following weak global manufacturing reports. Disappointing manufacturing data from the euro zone and China sent equity and crude oil prices lower for most of the session. China’s data was particularly worrisome as it showed the fastest contraction in China's enormous manufacturing sector in over three years. In the U.S., the Institute for Supply Management reported manufacturing activity came in with a reading of 48.2 for January indicating industrial activity is contracting. Elsewhere, the Mortgage Bankers Association released their latest Mortgage Application Data for the week ending January 29 showing the overall seasonally adjusted Market Composite Index decreased 2.6%. On an unadjusted basis, the Composite Index decreased by 11% week-over-week. The seasonally adjusted Purchase Index decreased 7.0% from the prior reporting period while the Refinance Index increased 0.3%. Overall, the refinance portion of mortgage activity increased to 59.2% of total applications from 59.0%. The adjustable-rate mortgage segment of activity decreased to 5.9% of total applications from 6.9%. The average contract interest rate for 30-year fixed-rate mortgages with conforming loan balance decreased from 4.02% to 3.97%. The week’s most significant economic report was released Friday when the stock and bond markets both moved lower following the Labor Department’s release of their Employment Situation Summary for January. The January jobs report saw Nonfarm Payrolls increase by 151,000 and Nonfarm Private Payrolls increase by 158,000. Those numbers missed the mark as the consensus forecast had called for the creation of 188,000 jobs in Nonfarm Payrolls and 183,000 in Nonfarm Private Payrolls. Furthermore, the jobs numbers for these two categories were both revised lower for December with Nonfarm Payrolls revised down to 262,000 from 292,000 and Nonfarm Private Payrolls revised lower to 251,000 from 275,000. While these were sizeable misses, the markets were more concerned about signs of wage inflation as Average Hourly Earnings rose 0.5% or 12 cents per hour and the Average Workweek crept higher to 34.6 hours from 34.5 hours. The consensus estimate had been for a 0.3% rise in Average Hourly Earnings. The Unemployment Rate edged lower to 4.9%, an eight-year low, as more workers dropped out of the labor force. The labor force participation rate, or the segment of working-age Americans who are employed or at least looking for a job, remained at near four-decade lows at 62.7%. However, the overall data suggests the labor market recovery remains firm as the manufacturing sector surprisingly added 29,000 positions, the most since August 2013. The jobs report also supports the notion that another rate hike will be “on the table” when the Federal Reserve conducts their next FOMC meeting on March 15-16. Expectations are now increasing that the Fed will raise rates by midyear or early in the second half of the year. In response to the report, the dollar rose against a basket of currencies as traders saw a greater probability for more rate hikes this year. With the strength in the dollar in the currency markets, crude oil prices retreated as did Treasuries and the major stock market indexes. For the week, the FNMA 3.5% coupon bond gained 9.4 basis points to end at $104.75 while the 10-year Treasury yield decreased 8.0 basis points to end at 1.843%. Stocks ended the week with the Dow Jones Industrial Average losing 261.33 points to end at 16,204.97. The NASDAQ Composite Index dropped 250.81 points to close at 4,363.14, and the S&P 500 Index fell 60.19 points to close at 1,880.05. Year to date, and exclusive of any dividends, the Dow Jones Industrial Average has lost 7.53%, the NASDAQ Composite Index has lost 14.77%, and the S&P 500 Index has lost 8.72%. This past week, the national average 30-year mortgage rate decreased to 3.77% from 3.78% while the 15-year mortgage rate fell to 3.05% from 3.09%. The 5/1 ARM mortgage rate decreased to 2.99% from 3.08%. FHA 30-year rates fell from 3.50% to 3.35% while Jumbo 30-year rates decreased to 3.58% from 3.61%.
Mortgage Rate Forecast with Chart For the week, the FNMA 30-year 3.5% coupon bond ($104.75, +9.4 bp) traded within a 56 basis point range between a weekly intraday low of $104.41 and a weekly intraday high of 104.97 before closing at $104.75 on Friday. The bond appears to building out a sideways consolidation between support at $104.516 and resistance at $105.15. Earlier in the week, the 25-day moving average crossed above the 100 and 200-day moving averages and this is a sign of market strength. This is tempered however with the extreme “overbought” values in the stochastic oscillators. These values have been extremely high over the past three weeks during the bond’s strong upward trend. It is rather unusual to see such a sustained move higher while under extreme overbought conditions over this length of time. As long as the bond remains above technical support, mortgage rates should hold relatively steady.
Chart: FNMA 30-Year 3.5% Coupon Bond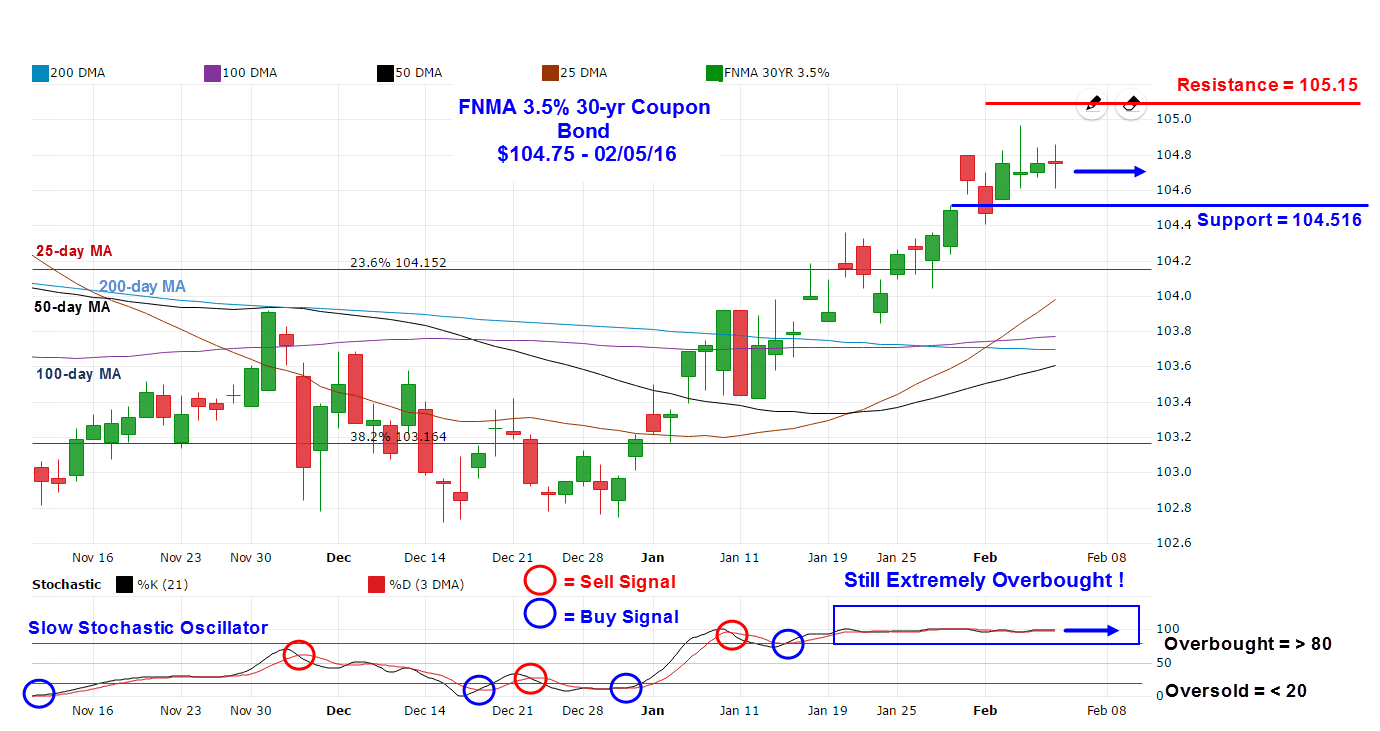 Economic Calendar - for the Week of February 8, 2016
 The economic calendar shrinks this coming week with half of the releases taking place on Friday. Crude Oil Inventories on Wednesday, Initial Jobless Claims on Thursday, and Retail Sales on Friday will attract the most scrutiny among investors. Economic reports having the greatest potential impact on the financial markets are highlighted in bold.
| Date | TimeET | Event /Report /Statistic | For | Market Expects | Prior |
| Feb 09 | 10:00 | Wholesale Inventories | Dec | 0.0% | -0.3% |
| Feb 10 | 07:00 | MBA Mortgage Index | 02/06 | NA | -2.6% |
| Feb 10 | 10:30 | Crude Oil Inventories | 02/06 | NA | +7.79M |
| Feb 10 | 14:00 | Treasury Budget | Jan | NA | -$14.4B |
| Feb 11 | 08:30 | Initial Jobless Claims | 02/06 | 280,000 | 277,000 |
| Feb 11 | 08:30 | Continuing Jobless Claims | 01/30 | NA | 2,255K |
| Feb 12 | 08:30 | Import Prices excluding oil | Jan | NA | -0.4% |
| Feb 12 | 08:30 | Export Prices excluding agriculture | Jan | NA | -1.0% |
| Feb 12 | 08:30 | Retail Sales | Jan | +0.2% | -0.1% |
| Feb 12 | 08:30 | Retail Sales excluding automobiles | Jan | 0.0% | -0.1% |
| Feb 12 | 10:00 | Business Inventories | Dec | +0.1% | -0.2% |
| Feb 12 | 10:00 | Univ. of Michigan Consumer Sentiment Index | Feb | 92.7 | 93.3 |
