Mortgage bond and U.S. Treasury prices finished the week close to where they began, although the yield curve steepened somewhat as shorter-term yields declined slightly. Early in the week, Treasury yields increased, but then dropped when weaker economic data provided investors more assurance the Fed will not raise interest rates until their December 14 FOMC meeting. Weaker economic data released during the week included Retail Sales falling 0.3% in August while Industrial Production for August showed a 0.4% decline as did manufacturing, which accounts for 80% of total industrial output. Still, the Labor Department reported inflation edged higher at the consumer level with the August Consumer Price Index (CPI) rising 0.2% compared to the consensus forecast of a 0.1% gain. Rising rents (+0.3%) and healthcare costs (+1.0%) were cited as reasons for the unexpected increase in the CPI. On an annual basis through August, the CPI has increased 1.1%. When excluding volatile food and energy costs, the so-called Core CPI increased 0.3%, the largest increase since February. The consensus forecast had called for only a 0.2% increase in the Core CPI. The Core CPI has now increased 2.3% during the past 12 months through August. However, the financial markets have virtually rejected a rate increase next week as the Fed Funds Futures market is now showing the implied probability of a rate hike has only increased to 15.0% on Friday from 12.0% on Thursday. Many economists now expect the Fed will hike interest rates by 25 basis points in December as the probability of a rate hike at the December FOMC meeting has increased to 45.4% from 39.6% on Thursday. As for mortgages, the Mortgage Bankers Association (MBA) released their latest Mortgage Application Data for the week ending September 10
th showing the overall seasonally adjusted Market Composite Index increased 4.2%. The seasonally adjusted Purchase Index rose 9.0% from the prior week, while the Refinance Index increased 2.0%. Overall, the refinance portion of mortgage activity increased to 64.0% of total applications from 63.5% in the prior week. The adjustable-rate mortgage share of activity fell to 4.3% of total applications from 4.6% in the prior week. According to the MBA, the average contract interest rate for 30-year fixed-rate mortgages with a conforming loan balance increased from 3.67% to 3.68% with points increasing to 0.37 from 0.33. For the week, the FNMA 3.0% coupon bond lost 3.1 basis points to end at $103.47 while the 10-year Treasury yield increased 1.94 basis points to end at 1.6943%. Stocks ended the week higher with the Dow Jones Industrial Average adding 38.35 points to end at 18,123.80. The NASDAQ Composite Index gained 118.66 points to close at 5,244.57, and the S&P 500 Index rose 11.35 points to close at 2,139.16. Year to date, and exclusive of any dividends, the Dow Jones Industrial Average has gained 3.86%, the NASDAQ Composite Index has added 4.52%, and the S&P 500 Index has advanced 4.45%. This past week, the national average 30-year mortgage rate increased to 3.47% from 3.46% while the 15-year mortgage rate increased to 2.82% from 2.80%. The 5/1 ARM mortgage rate fell to 2.86% from 2.90%. FHA 30-year rates increased to 3.30% from 3.25% and Jumbo 30-year rates increased to 3.62% from 3.60%.
Economic Calendar - for the Week of September 19, 2016 Economic reports having the greatest potential impact on the financial markets are highlighted in bold.
| Date | TimeET | Event /Report /Statistic | For | Market Expects | Prior |
| Sept 19 | 10:00 | NAHB Housing Market Index | Sept | 59 | 60 |
| Sept 20 | 08:30 | Housing Starts | Aug | 1,186K | 1211K |
| Sept 20 | 08:30 | Building Permits | Aug | 1,160K | 1152K |
| Sept 21 | 07:00 | MBA Mortgage Index | 09/17 | NA | 4.2% |
| Sept 21 | 10:30 | Crude Oil Inventories | 09/17 | NA | -0.559M |
| Sept 21 | 14:00 | FOMC Rate Decision | Sept | 0.375% | 0.375% |
| Sept 22 | 08:30 | Initial Jobless Claims | 09/17 | 262,000 | 260,000 |
| Sept 22 | 08:30 | Continuing Jobless Claims | 09/10 | NA | 2,143K |
| Sept 22 | 09:00 | FHFA Housing Price Index | July | NA | 0.2% |
| Sept 22 | 10:00 | Existing Home Sales | Aug | 5.50M | 5.39M |
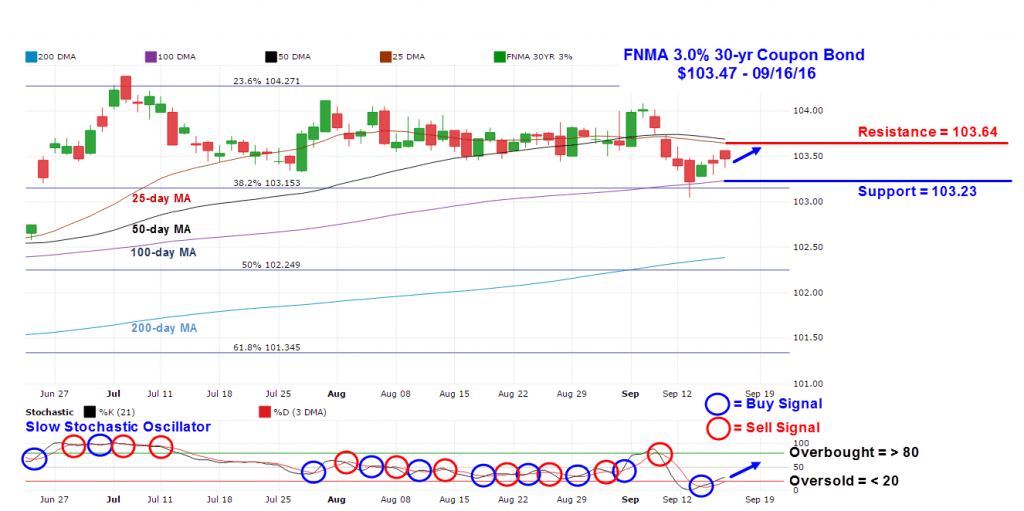
Mortgage Rate Forecast with Chart For the week, the FNMA 30-year 3.0% coupon bond ($103.47, -3.1 basis points) traded within a narrower 56 basis point range between a weekly intraday high of $103.61 on Monday and a weekly intraday low of $103.05 on Tuesday before closing the week at $103.47. The bond bounced higher off of support provided by the 100-day moving average at $103.23 and advanced toward overhead resistance located at the 25-day moving average at $103.64. The slow stochastic oscillator is continuing to trend higher after showing a positive crossover buy signal this past Wednesday. If stocks continue to show weakness this coming week, the bond should challenge resistance early in the week. A break above resistance would result in a slight improvement in rates.
Chart: FNMA 30-Year 3.0% Coupon Bond