
The stock market turned in a second consecutive week of gains as crude oil prices continued to play a significant role in driving market action in both stocks and bonds. Lately, there has been close to a 95% positive correlation between how the crude oil and stock markets have been trading. This means about 95% of the time oil and stocks trade in the same direction while the bond market generally trades in the opposite direction to the stock market. Early in the week bond prices moved modestly lower while crude oil and stocks rallied following the release of the International Energy Agency’s (IEA) latest version of its Medium-Term Oil Market Report. The IEA report stated the current oversupply in crude oil should gradually diminish through 2016 and should rebalance with demand sometime in 2017. This was perceived by investors as good news for the energy sector and as a result, energy stocks rallied along with the broader stock market. The week’s economic reports were “mixed,” but the rebound in crude oil and the positive economic data helped keep bond yields close to where they began for the week. Despite a weak reading on manufacturing activity, durable goods orders jumped a solid 4.9% in January to easily surpass the consensus forecast of 2.0%. Personal income and spending both saw solid increases of 0.5% in January to surpass their consensus estimates of 0.4% and 0.3% respectively. Investors also noticed a solid 0.3% rise in the Core Personal Consumption Expenditures Index. This Index, which excludes food and energy prices, is widely recognized as the Federal Reserve’s preferred measure of inflation. However, most of this increase was in volatile categories such as airfares and hotel room prices and may not be sustainable going forward. Friday, the bond market was stifled by a favorable second estimate report on fourth quarter GDP showing the economy expanded by 1.0% during the fourth quarter rather than the preliminary estimate of 0.7%. The second estimate for GDP also easily exceeded the consensus forecast of 0.4%. Higher inventories and net exports were responsible for the surprisingly higher growth in GDP. Also, the GDP deflator for the fourth quarter, a measure of inflation, was revised slightly higher to 0.9% from an initially reported 0.8%. Treasuries sold off sharply following this release. There was a considerable amount of housing news this past week. The National Association of Realtors reported Existing Home Sales for January increased to a 5.47 million annual rate, exceeding the consensus forecast of 5.30 million while recording the second-highest rate since 2007. There currently is a 4.0 month supply of unsold homes inventory at the current sales rate. This is significantly lower than the usual 6.0 month supply that is normally associated with a normal period of buying and selling. The median home price in January for all housing types was $213,800, rising 8.2% on a year-over-year basis. Furthermore, the Case-Shiller 20-city Index showed a year-over-year gain of 5.7% in December, the same as November. The National Home Price Index recorded a slightly higher year-over-year gain of a 5.4% annual increase in December 2015 versus a 5.2% increase in November 2015. On a month-over-month basis after seasonal adjustment, the National and 20-city Indexes both posted gains of 0.8% in December. Also, the U.S. Census Bureau and the Department of Housing and Urban Development reported New Homes Sales fell to a seasonally adjusted annual rate of 494,000 in January, missing the consensus forecast of 523,000. This was a decrease of 9.2% from the December reading of 544,000 and a decrease of 5.2% from the January 2015 rate of 521,000. The median new home sales price for homes sold in January declined by more than $10,000 from $288,900 in December to $278,800 while the average sales price fell by $9,200 to $365,700. The current sales rate at the end of January represents a supply of 5.8 months with 238,000 new homes for sale. Elsewhere, the Mortgage Bankers Association released their latest Mortgage Application Data for the week ending February 19 showing the overall seasonally adjusted Market Composite Index decreased 4.3%. On an unadjusted basis, the Composite Index decreased by 12% week-over-week. The seasonally adjusted Purchase Index increased 2% from the prior reporting period while the Refinance Index decreased 8.0%. Overall, the refinance portion of mortgage activity decreased to 61.0% of total applications from 64.3%. The adjustable-rate mortgage segment of activity decreased to 5.8% of total applications from 6.7%. For the week, the FNMA 3.0% coupon bond lost 18.8 basis points to end at $102.36 while the 10-year Treasury yield increased 2.1 basis points to end at 1.76%. Stocks ended the week with the Dow Jones Industrial Average increasing 247.98 points to end at 16,639.97. The NASDAQ Composite Index added 86.04 points to close at 4,590.47, and the S&P 500 Index gained 30.27 points to close at 1,948.05. Year to date, and exclusive of any dividends, the Dow Jones Industrial Average has lost 4.72%, the NASDAQ Composite Index has lost 9.08%, and the S&P 500 Index has lost 4.92%. This past week, the national average 30-year mortgage rate increased to 3.67% from 3.64% while the 15-year mortgage rate rose to 2.97% from 2.96%. The 5/1 ARM mortgage rate increased to 2.98% from 2.90%. FHA 30-year rates held steady at 3.25% and Jumbo 30-year rates increased to 3.51% from 3.48%. Mortgage Rate Forecast with Chart I have switched technical analysis from the FNMA 3.5% coupon bond to the FNMA 3.0% coupon bond to more accurately reflect the Federal Reserve’s mortgage bond buying focus and trading volume. For the week, the FNMA 30-year 3.0% coupon bond ($102.36, -18.8 bp) traded within a wider 70 basis point range between a weekly intraday low of $102.22 and a weekly intraday high of 102.92 before closing at $102.36 on Friday. As forecast last week, the bond essentially traded in a sideways direction this past week. The bond did take a step lower on Friday, moving below primary support defined by the 23.6% Fibonacci retracement level at $102.378 toward secondary support at the 25-day moving average at $102.16. The downward move resulted in a new sell signal from a negative crossover in the slow stochastic oscillator, so we could see some downward continuation for a test of support at the 25-day moving average this coming week before hopefully seeing a bounce higher. The February Employment Situation Summary scheduled for release on Friday morning could be a catalyst for a major move in the bond market that could force the bond out of its recent sideways trading pattern. If the Nonfarm Payrolls and Nonfarm Private Payrolls numbers are meaningfully greater than forecast, we could see bond prices move significantly below support levels. Should this happen, mortgage rates would undoubtedly move slightly higher. If the payrolls numbers are close to or worse than the consensus estimates, we could see bond prices improve with rates holding steady or slightly improving. Chart: FNMA 30-Year 3.0% Coupon Bond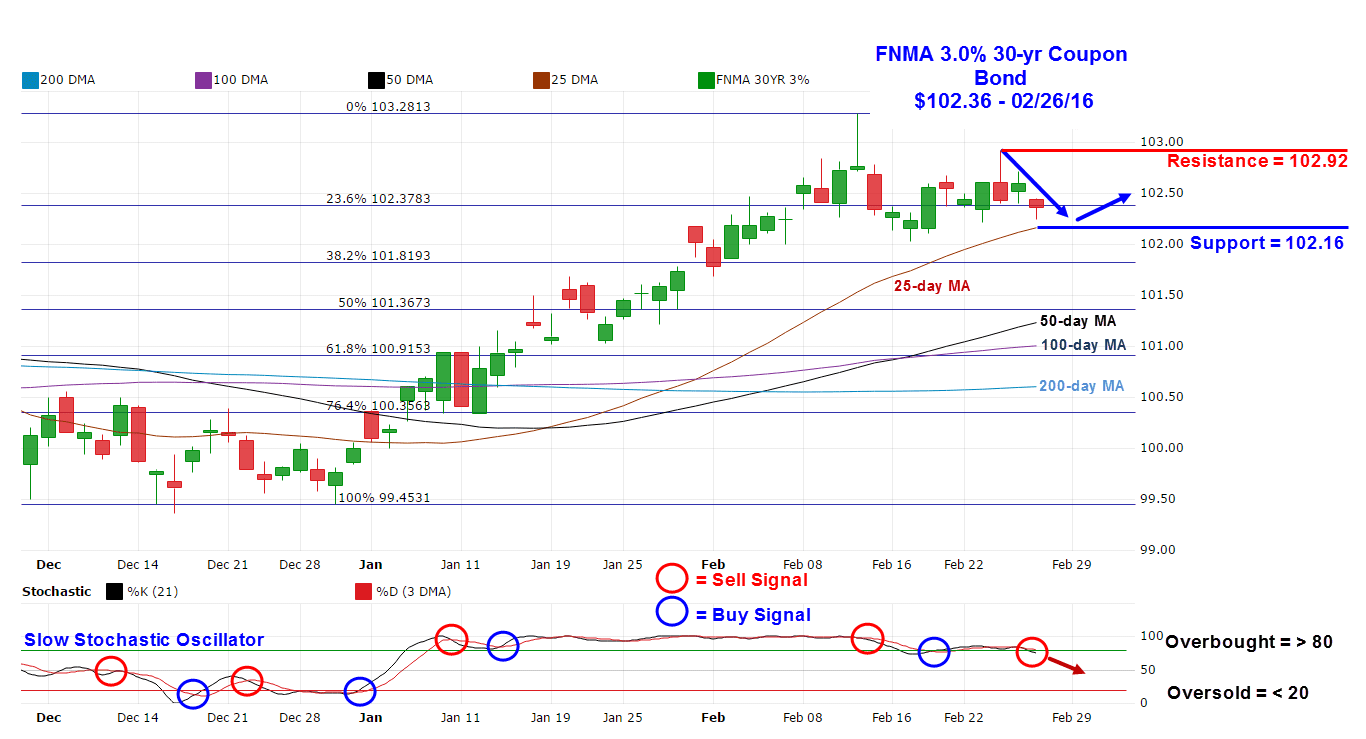 Sourece: MBSHighway
Sourece: MBSHighway