 Home prices continue their upward climb.
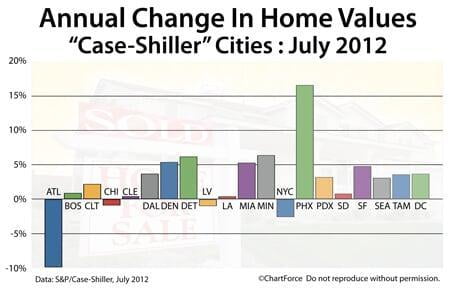
Last week, the S&P/Case-Shiller Index showed home prices gaining 5.5 percent during the 12-month period ending November 2012, marking the largest one-year gain in home prices since May 2010.
The Case-Shiller Index measures changes in home prices by tr...
 The U.S. housing market continues to make home price gains.
Earlier this week, the S&P/Case-Shiller Index showed home prices gaining 4.3 percent during the 12-month period ending October 2012, marking the largest one-year gain in home prices since May 2010.
The Case-Shiller Index measures changes ...
The housing market continues to expand.
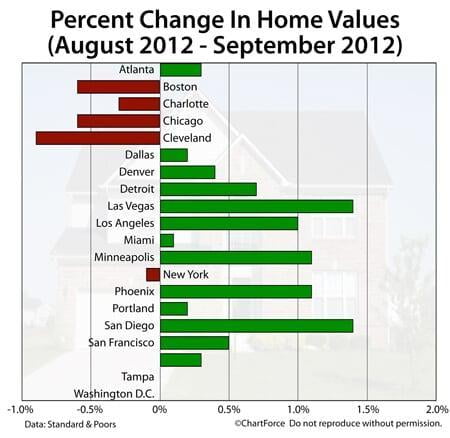
According to the S&P/Case-Shiller Index, which was released earlier this week, U.S. home prices rose in September for the sixth straight month, climbing 0.3% as compared to the month prior.
On an annual basis, values are higher by 3.0%.
The Case-Shiller Index...
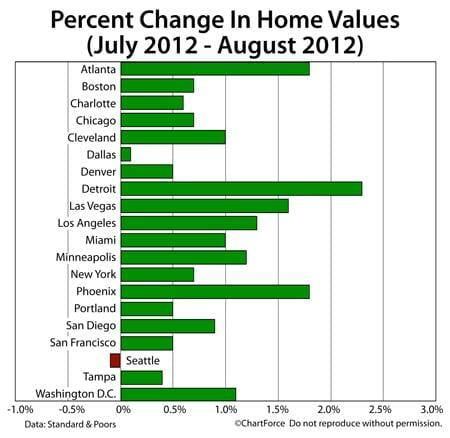
Home value rose to close out the summer, according to the S&P/Case-Shiller Index, a national home-valuation tracker.
Nationwide, values rose 0.9% between July and August 2012 with 19 of 20 tracked markets showing improvement. Only one tracked city -- Seattle, Washington -- showed a decrease, fall...
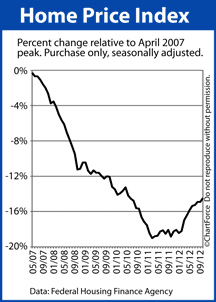
There have been no shortage of "housing market" stories lately. After sinking through much of late-last decade, home values slowly stabilized into mid-2011. By October 2011, values appeared to have bottomed.
Today, nearly five-and-one-half years after the April 2007 housing market peak, hom...
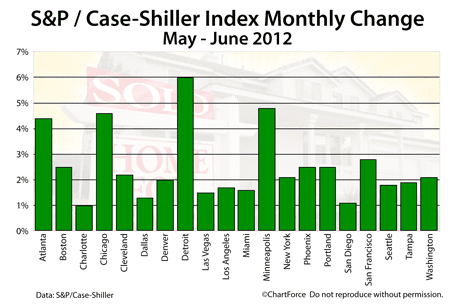
Home prices continue to rise nationwide.
According to the Standard & Poor's Case-Shiller Index, home prices rose 6.9% between the first and second quarter of 2012, the largest quarter-to-quarter gain since the home-value tracker's 1987 inception and another signal that the housing market is...
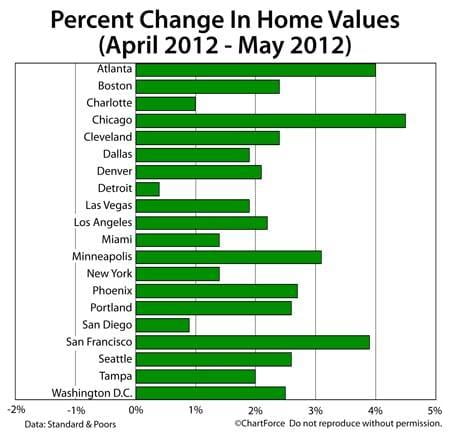
According to the S&P/Case-Shiller Index, home values rose 2.2% nationwide, with all 20 tracked markets making month-to-month improvement. On an annual basis, 17 of the 20 Case-Shiller Index markets improved.
Despite the positive report, however, our enthusiasm for the May Case-Shiller I...
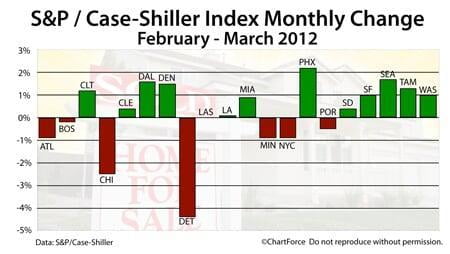 Standard & Poors released its March 2012 Case-Shiller Index last week. The index is meant to measure changes in home prices from month-to-month, and from year-to-year, in select U.S. cities. According to the report, home values rose in 12 of the Case-Shiller Index's 20 tracked markets, and one ...
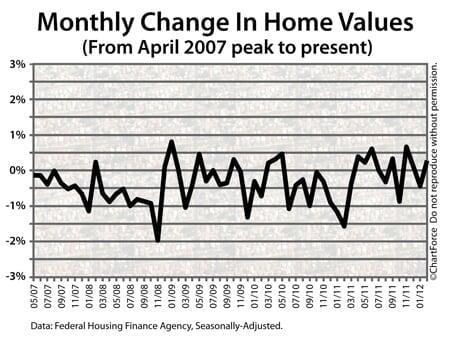
Home prices started the year on an upswing.
According to the Federal Home Finance Agency's Home Price Index, home prices rose by a seasonally-adjusted 0.3 percent between January and February 2012. The index is up 0.4% over the past year, offering a counter-story to the Case-Shiller I...
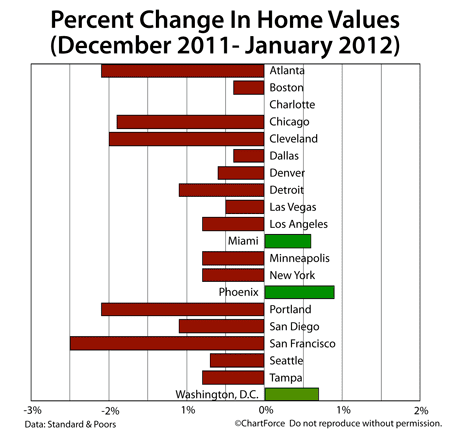
Recent data suggests that the U.S. housing market is in recovery. However, the data also shows this to be an uneven recovery.
According to the monthly S&P/Case-Shiller Index, for example, home values rose in three of 20 tracked markets between December 2011 and January 2012. 17 tracked markets sh...
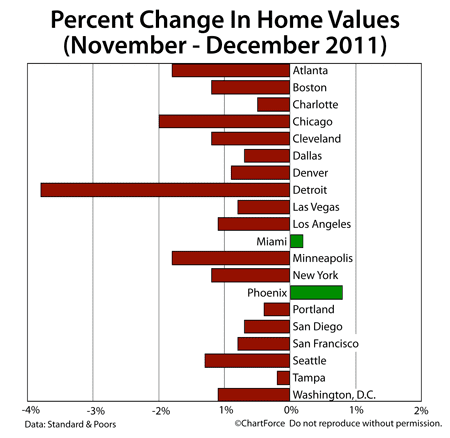
Standard & Poors released its December 2011 Case-Shiller Index this week. The report is the most widely-cited, private-sector metric for the housing market. The index aims to measures change in home prices from month-to-month, and from year-to-year, in select U.S. cities and nationwide.
According...
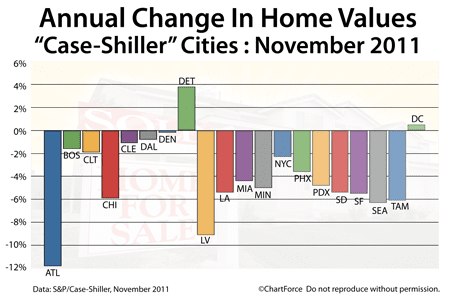 Standard & Poors released its November 2011 Case-Shiller Index this week. The index measures the change in home prices from month-to-month, and year-to-year, in select U.S. cities. According to the data, for the second straight month, home values fell in 19 of the Case-Shiller Index's 20 tracke...
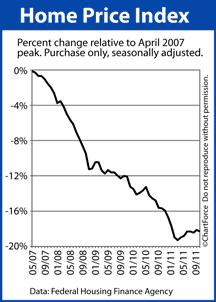 The government confirms what the private-sector Case-Shiller Index reported yesterday. Nationwide, average home values slipped in October.
The Federal Home Finance Agency's Home Price Index shows home values down 0.2% on a monthly, seasonally-adjusted basis. October marks just the second time since A...
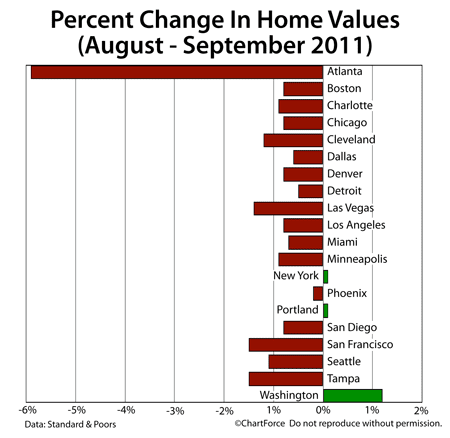 Standard & Poor's released its September 2011 Case-Shiller Index this week. The index tracks home price changes in select cities between months, quarters, and years. The Case-Shiller Index for September showed drastic devaluations nationwide. As compared to August, home values fell throughout 1...
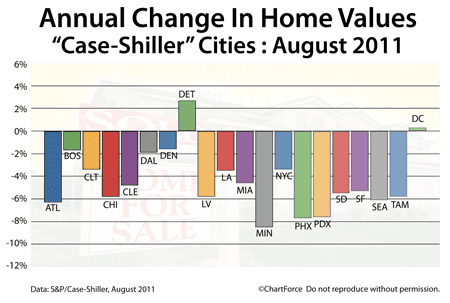
The August 2011 Case-Shiller Index was released this week. On an monthly basis, 10 of 20 tracked markets worsened. On an annual basis, valuation degradation was worse.
Only Detroit and Washington, D.C. posted higher home values in August 2011 as compared to August 2010, rising 2.7% and 0.3%...
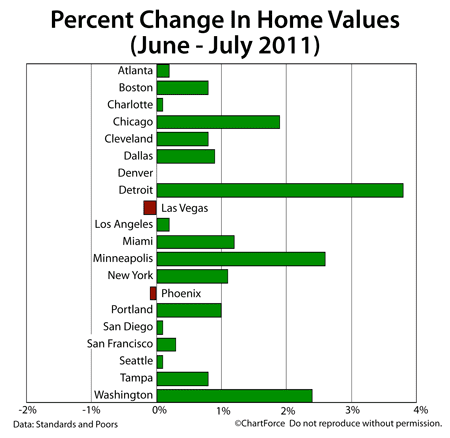
Standard & Poors released its monthly Case-Shiller Index this week. The Case-Shiller Index measures home price changes from month-to-month, and year-to-year, in 20 select U.S. cities. It also reports a "national" index; a composite of the values in said cities.
The most recent Case-Shil...
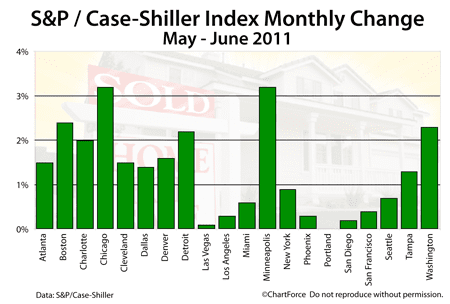 Has housing turned the corner for good? The June 2011 Case-Shiller Index reading posted strong numbers across the board, with each of the index's 20 tracked markets showing home price improvement from May. Some markets -- Chicago and Minneapolis -- rose as much as 3.2 percent. The rise in val...
(1)
(3)
(8)
(1)
(5)
(9)
(3)
(227)
(2)
(1)
(3)
(1)
(50)
(185)
(5)
(1)
(57)
(1)
(7)
(13)
(29)
(373)
(4)
(14)
(20)
(8)
(22)
(53)
(3)
(7)
(37)
